Ioto® IoT Apps
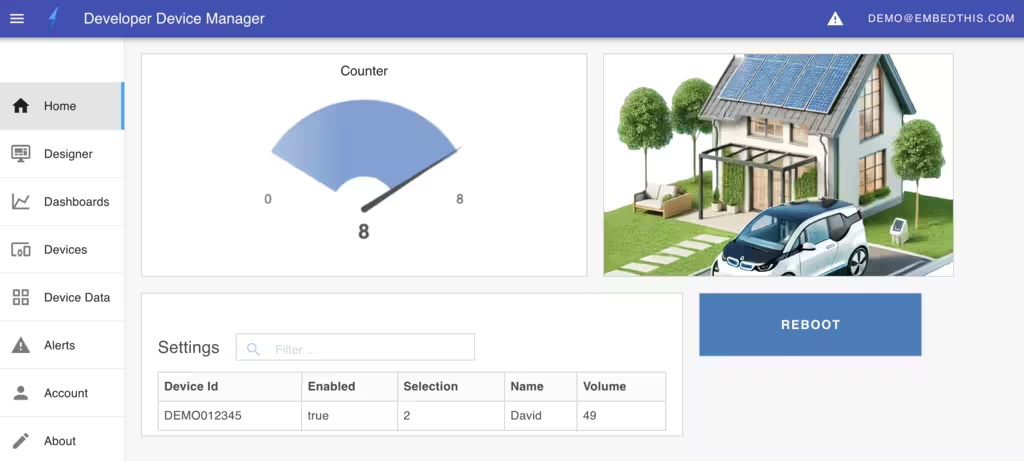
IoT device management apps enable you to control and monitor your devices and cloud services. With the Builder, you can create one or more apps tailored for device management. These IoT apps can support local management through the agent’s embedded web server or facilitate remote management via the cloud.
You can customize IoT apps to suit different user groups, including end-users, developers, and support teams. For cloud-based management, the Builder streamlines global deployment by hosting and distributing the apps through device clouds.
DevCore UI Framework
IoT apps can be built two ways: using the EmbedThis DevCore UI framework or they can be developed as custom applications utilizing the Ioto APIs.
The DevCore framework is a versatile JavaScript UI library designed for device management across mobile, tablet, and desktop platforms. It provides essential features, including authentication, state management, request handling, navigation, device configuration, and data visualization.
With DevCore, you can create visually engaging user interfaces using a low-code visual app designer, enabling efficient and appealing app development.
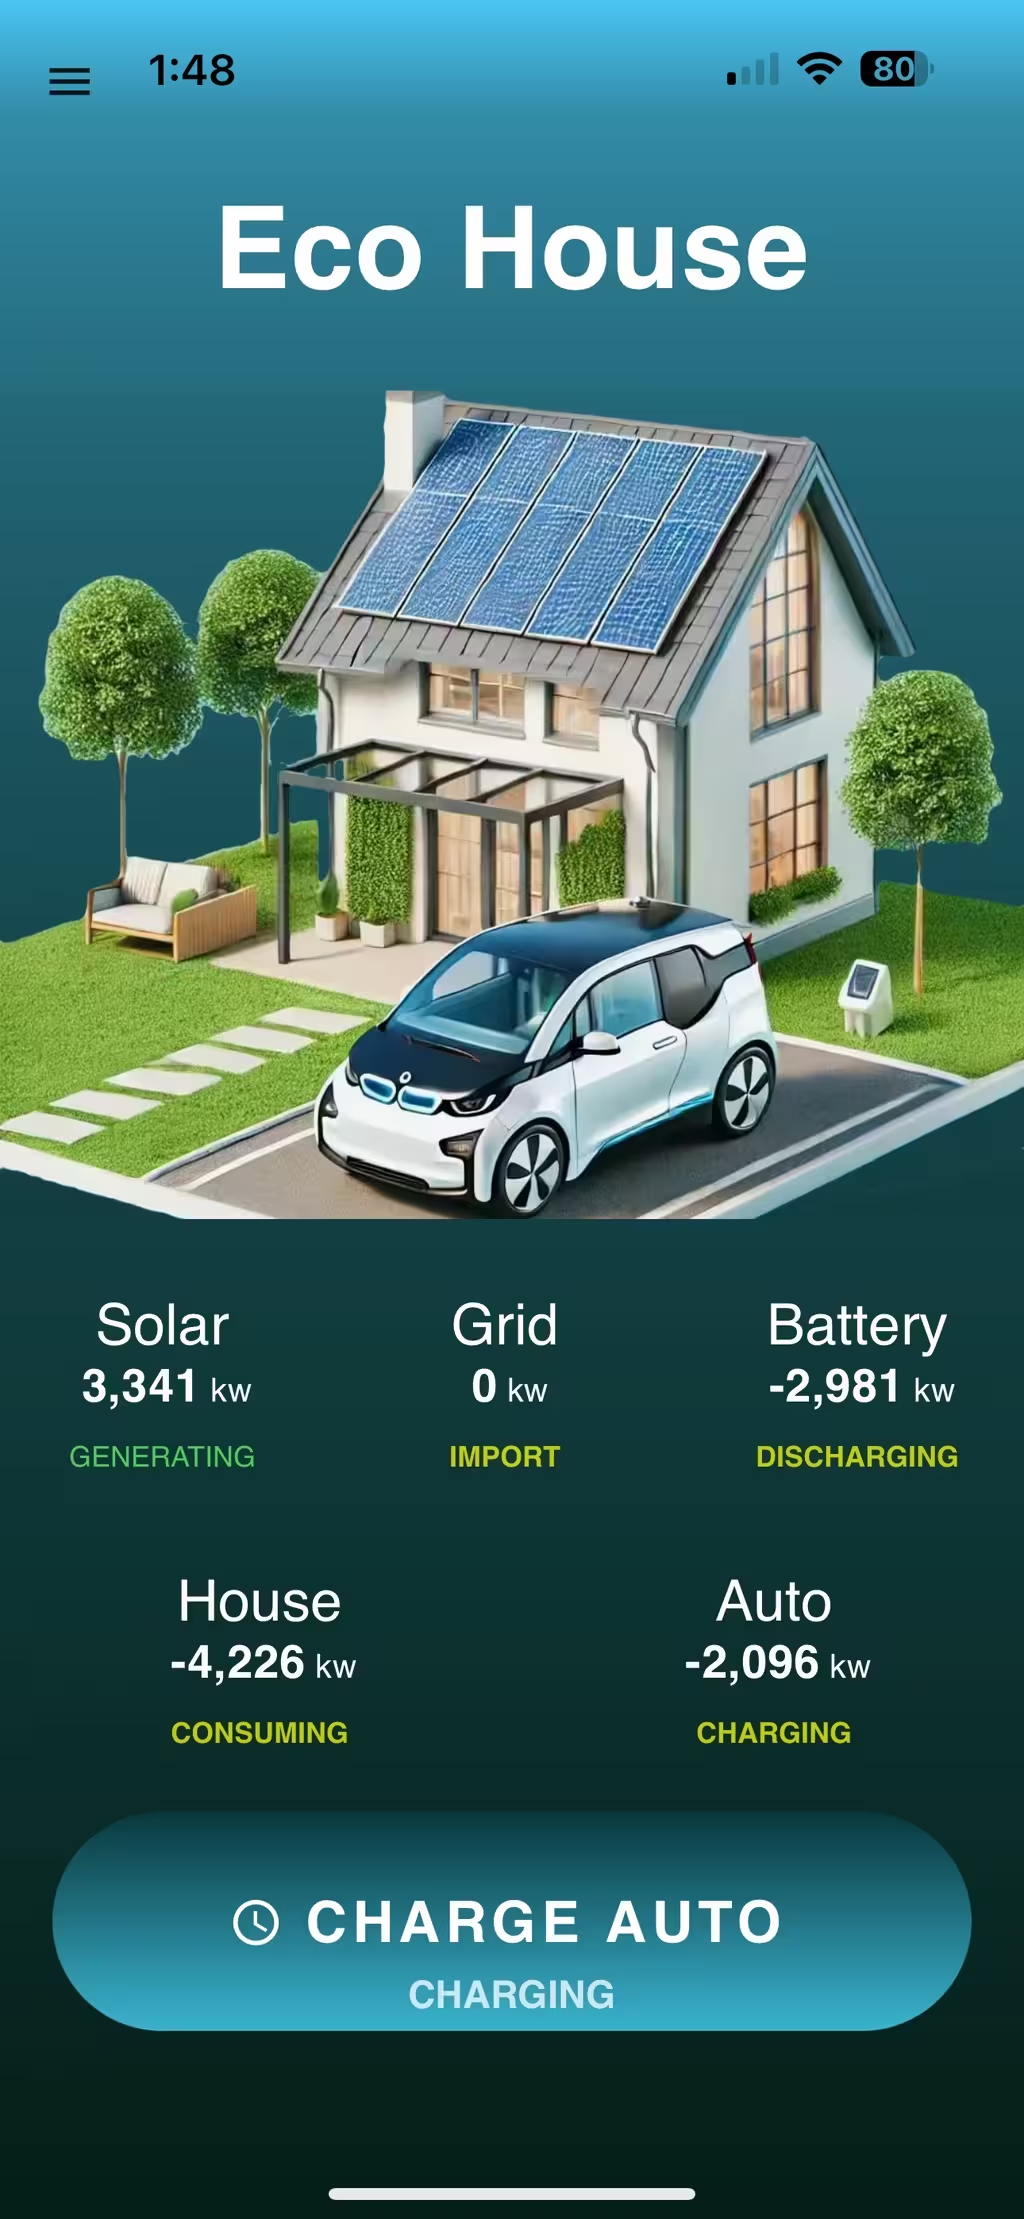
The DevCore framework offers the following features:
- Pre-built components for authentication, navigation, dashboards, graphs, deployment, input forms, and monitoring.
- Customization options for product name, logo, and color scheme.
- Support for tailored device data and custom UI screens.
- An integrated low-code app page designer for visually building screens and dashboards.
- Data widgets to display device data with advanced metrics and statistics.
- An API for creating custom UI components.
With DevCore, you can quickly build your app and then progressively tailor it to meet your specific device management requirements. This approach enables rapid progress in developing an IoT solution while maintaining the flexibility to create a fully customized device management application.
INFO
DevCore will save you months of development time in creating your device management app.
For use cases where the DevCore framework may not be suitable, you can leverage the Builder and Ioto service APIs directly to develop a unique device application using any app framework of your choice.
Low-Code App Designer
The DevCore framework includes an inbuilt, low-code App Designer so you can visually create a highly appealling app UI for mobile and desktop apps. With the App Designer you can create and customize the app's user interface without unnecessary coding.
The App Designer supports a drag-drop design pattern where you can select UI controls and widgets from an extensive library of over 30 widgets. There are widgets for graphs, tables, numerics, shapes, gauges, buttons, images, input controls for all types of data entry.
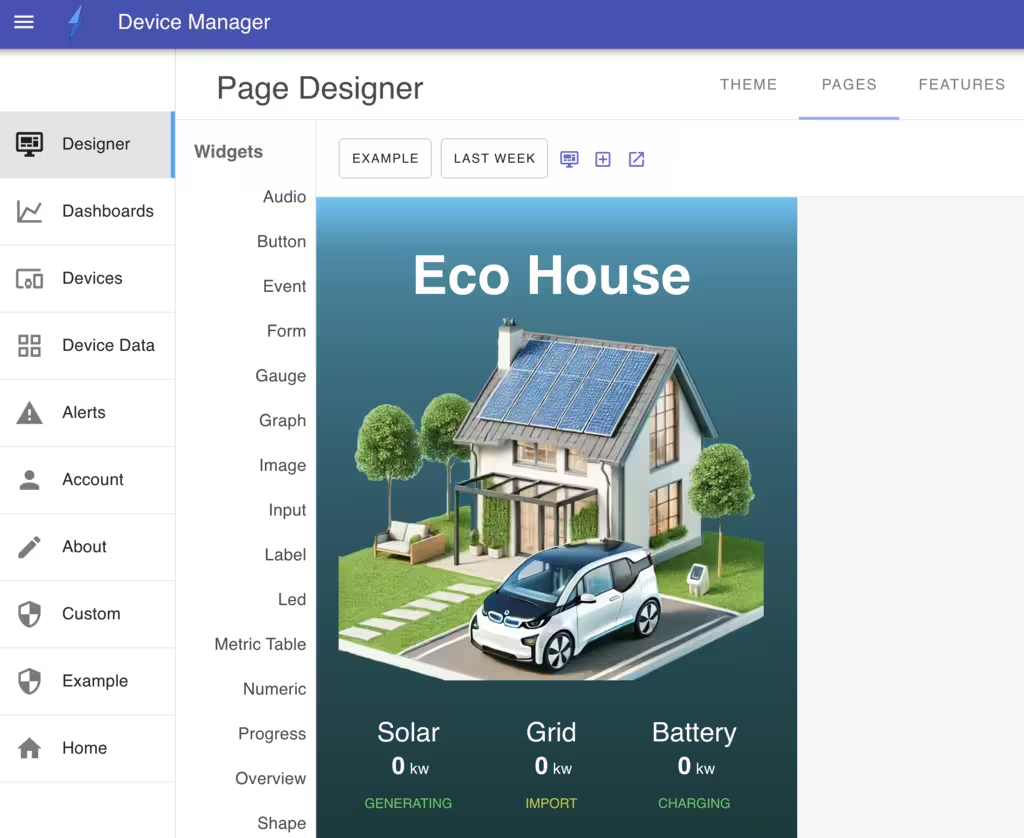
The App Designer is used to customize your app and to create and modify UI pages.
Standard App
The Builder provides a pre-built device management app that can be extensively customized to meet your specific needs. The Standard app uses the DevCore framework as a foundation. You can use the Standard app with the in-built App Designer to change the look and feel of the app and UI pages as required.
Creating Apps
IoT apps are created from the Builder's App list.

Once the app is created, you can launch the app from the Builer's app list and then you can modify the app UI and pages using the app's integrated low-code App Designer. This tool offers a visual interface for modifying the app UI and pages.
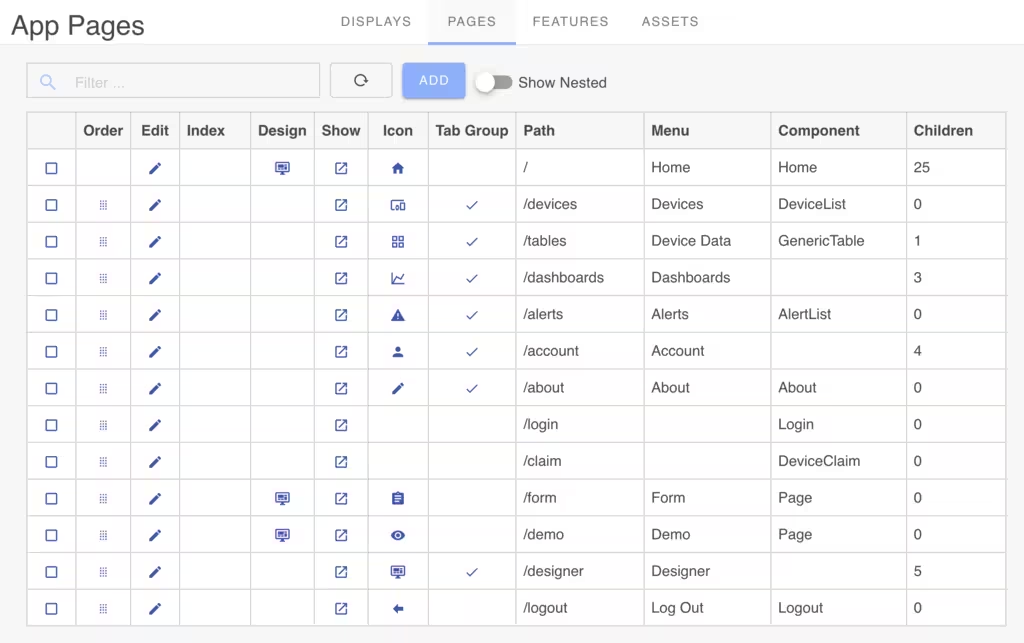
Developer UI
When you first define an app, the Builder creates a default management app based upon on the DevCore framework. This app has generic Developer UI suitable for testing your devices as you develop your IoT solution. This app UI can be progressively customized or extended to meet custom UI requirements.
