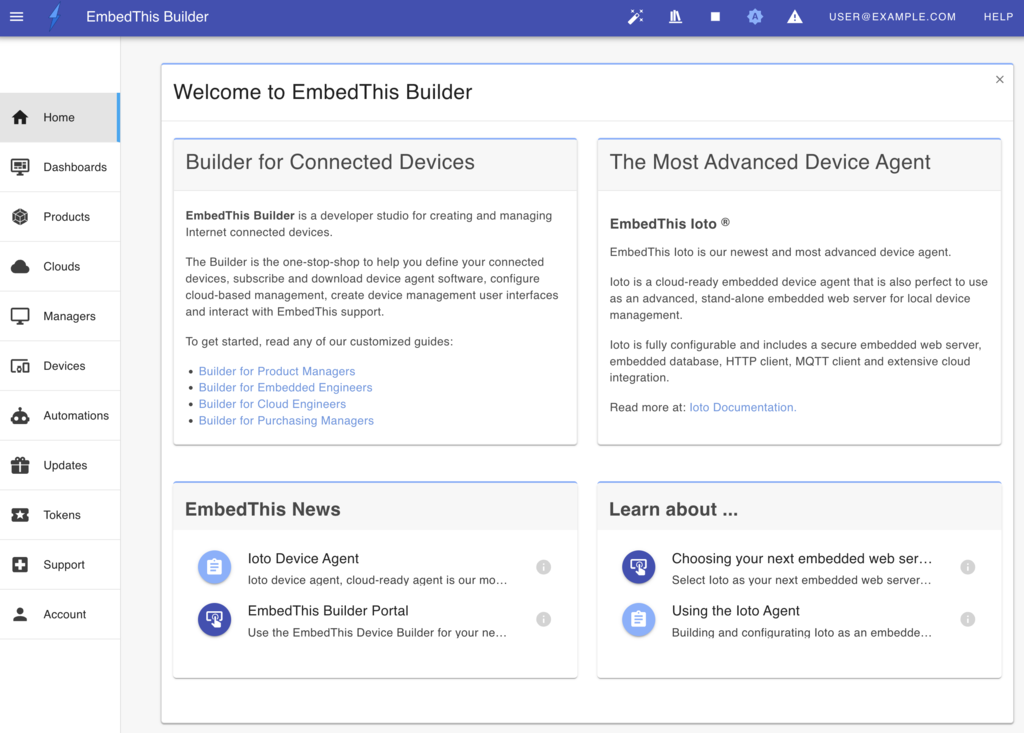
Skip to content

Builder Dashboard

Builder Dashboard

EmbedThis Builder offers customizable dashboards that display comprehensive metrics for your Ioto-based device clouds. Both Builder and Ioto services generate an extensive array of metrics, allowing you to monitor the performance of your devices and device clouds effectively.

These dashboards are highly adaptable; you can integrate widgets from the EmbedThis Ioto service, various AWS services, and even your own custom AWS CloudWatch metrics. Widgets can be added, removed, repositioned, and resized to meet your specific requirements.

Additionally, you can create multiple dashboards to concentrate on different operational aspects of your device clouds and device fleets.

Builder Dashboards offer support for:

  • Graphical widgets such as graphs, gauges, and numeric and text displays.
  • Customizable layouts with adjustable positioning and sizing of widgets.
  • Responsive designs that adapt to various screen sizes.
  • Creation of multiple dashboards, each focusing on different aspects of services.
  • A gallery featuring additional widgets and data sources.
  • An extensive library of pre-configured widget sets tailored to various AWS services.
  • The ability to save and share dashboard configurations with team members in your organization.

Widgets

The Builder supports a suite of widget types including: gauges, graphs, log and lambda views, numeric and text widgets and a top alerts widget.

You can configure widgets to display data from EmbedThis Ioto and most AWS services including: API Gateway, Billing, Certificate Manager, CloudFront, Cognito, CloudWatch Logs, DynamoDB, EventBridge, Lambda, Lambda Insights, Route53, S3, SES, SNS, States, Usage, X-Ray as well as your custom CloudWatch metrics.

Adding Widgets

To add widgets to the dashboard, click on the "Add Widget" button which will display the widget slide-out panel. From this panel, you can select your widget type and the wizard will then prompt for the required fields.

If you select a service overview, you can choose from overviews for AWS billing, CloudWatch, DynamoDB, EventBridge, Lambda, SES or SNS.

If you select to create a graphical widget, you can connect to a metric data source from AWS, Builder or any custom metric.

Add Widgets

Layout

You can adjust the layout of widgets on the dashboard by moving and resizing them. To move a widget, click and drag it from the title area to a new location. To resize a widget, click and drag the resize handle located at the bottom left corner to your preferred size. As you move or resize widgets, the dashboard automatically rearranges other widgets to prevent overlap and ensure clear visibility.

To remove a widget, click the (x) icon in the top left corner of the widget.

The dashboard offers four layout customization options that are accessible via the Dashboard toolbar icons and via the Dashboard Edit panel.

  • Snap to Grid - Aligns widgets to a 20-pixel grid, facilitating easier alignment.
  • Compact Widgets - Reduces empty spaces, compacting the overall widget layout.
  • Extend Widget Rows - Expands widgets horizontally to utilize all available space.
  • Reset Widgets - Reverts the dashboard to the last saved layout, discarding any unsaved changes.

These options help streamline the organization and appearance of your dashboard.

Metric Period

You can customize the data period for the graphs and metrics displayed on the dashboard. At the top center-right of the page, you can select the period to be per hour, day, week, month or custom period using the period button at the top right.

Date Range

Saving and Sharing

Dashboards may be saved and shared among team members.

When you make a modification to the dashboard such as resizing a widget or moving its position, a "Save" button will appear. Clicking save will persist the layout and set it as the new default layout for you and all other team members.

Save

Creating and Selecting Dashboards

You can create multiple dashboards that focus on different service aspects. For example, you may want a dashboard that features service load graphs and metrics and another dashboard to focus on outages and errors.

You can easily switch between dashboards by clicking on the name of the dashboard in the top left of the home page.

Dashboard Select

Select "New Dashboard" to display the "Select dashboard" slide out panel. Select "New Dashboard" and then enter your desired dashboard name.

You can also create a dashboard switch widget that lets you rapidly switch to another dashboard.