Metrics
Device Metrics refer to data points and measurements that provide insights into the performance, availability, and efficiency of your devices and device cloud. Metrics are essential for monitoring and managing your devices and ensuring the overall health of your device pool.
The Ioto service provides a set of standard metrics and you can create custom metrics based on your device specific data.
Using device data that is synchronized to the cloud from your devices, you can automatically create custom metrics from the data stream.
Metric Timespans
When the Ioto service creates metrics, it keeps the current live value and stores the historical metric values so you can monitor historical trends. Ioto metrics maintains statistics for the last "5 minutes", "hour", "day", "week" "month", or "year". Each of these ranges contain 10-12 data points.
When querying metrics, you can provide any data range and the relevant underlying metric data will be returned. You can also specify a date range start time and duration for metrics from any point in time.
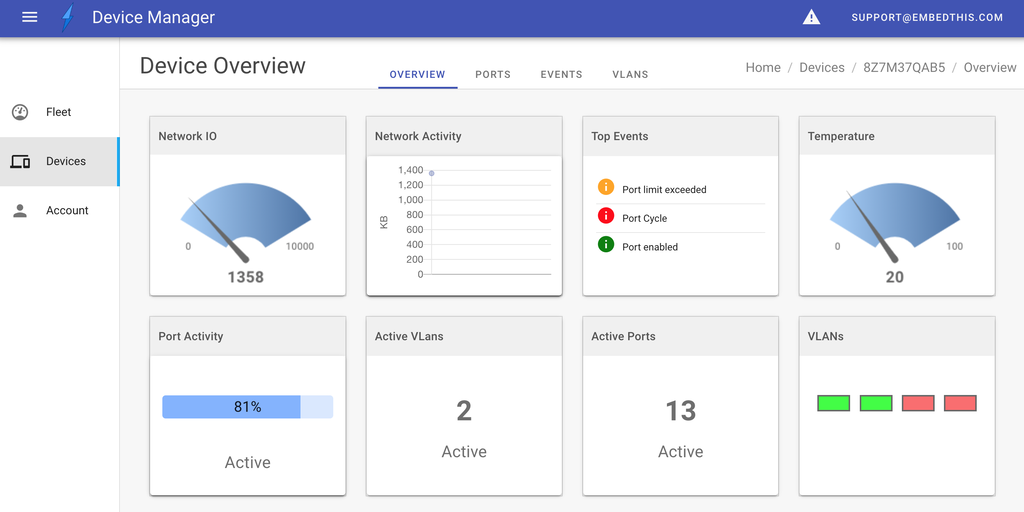
These metrics can then be monitored, displayed by the Device Manager as a single metric value or as set of values over time as a graph.
Metric Statistics
For each timespan, you can query the average, minimum, maximum or sum value for the metric.
Metric Naming
Metrics are scoped via a set of naming properties including:
- namespace
- metric name
- dimensions
The namespace is a global name to group related metrics. Currently, this must be set to Embedthis/Device.
The metric name is the specific metric name. For example: a device's temperature.
The dimensions select specific instances of a metric. For example, each device may have a temperature metric and we may also have an overall device pool average temperature metric. Ioto treats each unique combination of dimensions as a separate metric. Enter the dimensions as a comma separated list of dimensions. For example:
dimensions = "Process,Module"
Defining Metrics
Metrics are created by defining Builder Automation actions that create metrics based upon database values.
Metric API
Metrics can also be created in the Embedthis/Device namespace by using the Ioto Agent ioSetMetric API.
For example:
ioSetMetric("Temperature", 30.5, NULL, 0);Then to read the metric in the agent:
double temp = ioGetMetric("Temperature", NULL, "average", 3660);Displaying Metrics
The Device Manager can display metric data via graphical widgets

You can select from the following widget types:
- gauge
- graph
- table
- progress
- number
- leds
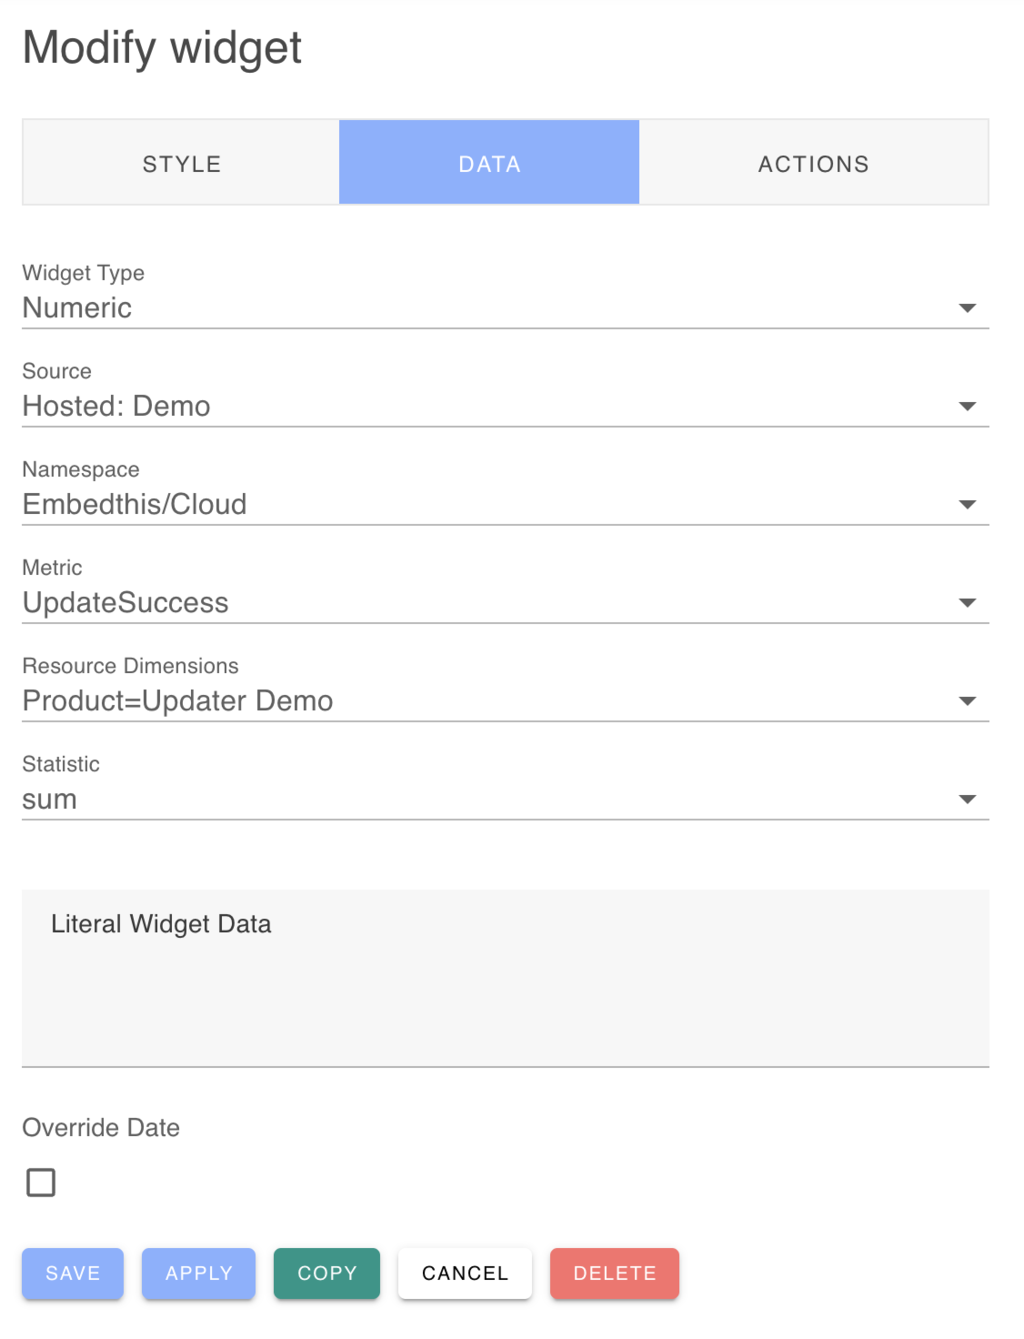
When creating or modifying a widget, you can select the data source to be either a database table item or a metric.
When selecting a metric, you enter the metric name, statistic and resource dimensions.
When selecting data directly from the database, you enter the database table model name, the model field (attribute) and a row selection expression.

Standard Metrics
The Ioto service computes standard metrics for each device cloud using the Embedthis/Ioto namespace.
Metric | Dimensions | Description -|-| DevicesMade | Product:PRODUCT | Number of devices manufactured this month DevicesClaimed | Product:PRODUCT | Number of devices claimed for cloud-based management this month DevicesConnected | | Number of devices connecting to the cloud this month MsgIn | | Number of messages received by the cloud MsgOut | | Number of messages sent by the cloud Throttles | | Number of times a device sending too much data was throttled SyncIn | | Number of database synchronization messages sent to the cloud SyncOut | | Number of database synchronziation messages sent to devices
Custom Metrics
Custom metrics created from device data streams are created using the Embedthis/Device namespace.
