Widget Data
Widgets can retrieve and display metric and database information for devices and for device cloud and Builder services. Widgets automatically refresh the displayed data according to the Dashboard refresh rate. Widgets can present current data or data for historial metrics.
The Widget Data panel configures the widget data source, table, metrics, dimensions and statistic to display.

Data Sources
The Builder dashboard can provide widget data from the Builder service or from any Device Cloud. If you are using a device App dashboard, the data source is always your device cloud for the app.
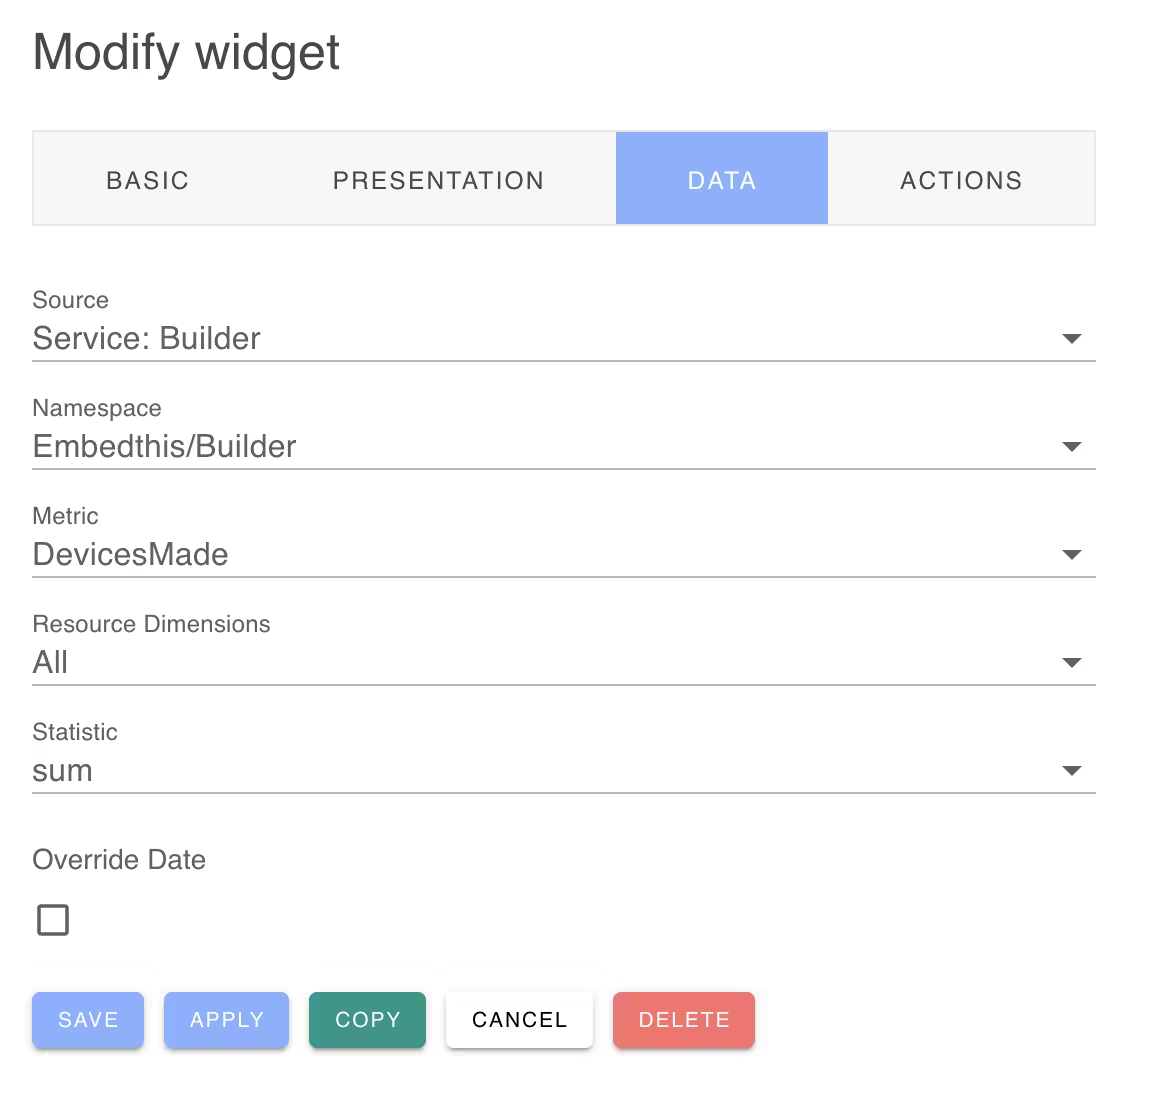
If using the Builder dashboard, select the desired data source from the Source pulldown list. Depending on your device clouds you will one or more data sources:
- Service: Builder
- Hosted: Hosted Cloud Name
- Dedicated: Dedicated Cloud Name
Data Namespaces
Available device and cloud data is grouped into namespaces that define a realm of available data for presentation. The Builder and Device Clouds create a large selection of service and device metric that provide real-time and historical data.
The supported metric namespaces are:
| Namespace | Dashboards | Description |
|---|---|---|
| Database | App | Device database data |
| Embedthis/Device | App | Device metrics |
| Embedthis/Builder | Builder | Builder service metrics |
| Embedthis/Cloud | Builder | Cloud service metrics including software updates |
| Embedthis/Ioto | Builder | Cloud service metrics for Ioto including the number of devices claimed, connected, provisioned and message traffic metric |
| Embedthis/Manager | Builder | End-user metrics including the number of user registrations and device manager sessions. |
Some namespaces are only available in the Builder and some only in device Apps.
If you are using a dedicated device cloud, the namespace list will include the standard and custom AWS CloudWatch metrics for services you are currently utilizing or have enabled.
Device Database Data
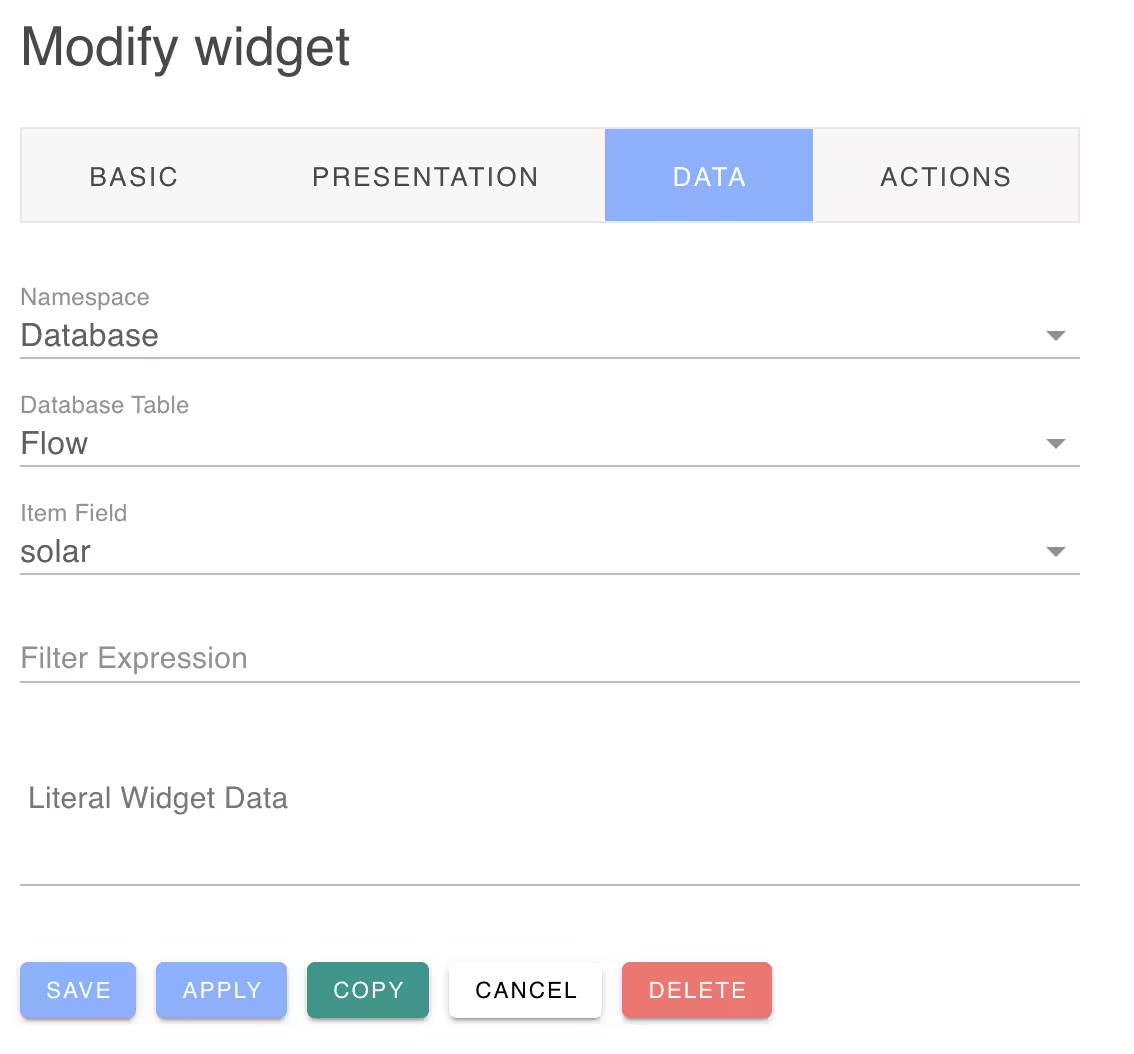
The special namespace "Database" is available in App dashboards and represents raw device database data.

After selecting the Dashboard namespace, select the database table and field (column) value you require. For multi-row tables, you can enter a filter expression of the form:
1 | |
This will select the desired database table row/item.
Metric Data
For metric namespaces, you specify the metric name, statistic and dimensions to select a required metric.

The available metrics are provided in the Metric pulldown selection list.
The supported metric statistics are: min, max, avg, sum, count and current. Sum is the sum of values over the request period. Count is the number of values sampled over the period. Current is the most recent updated value.
Some metrics have dimensions where specific resources have unique metric values. For example, you may have a "Temperature" metric for a device but also have "Temperature" metrics for each element of the device.
The Resource Dimensions pulldown list provides the available metrics on your system.
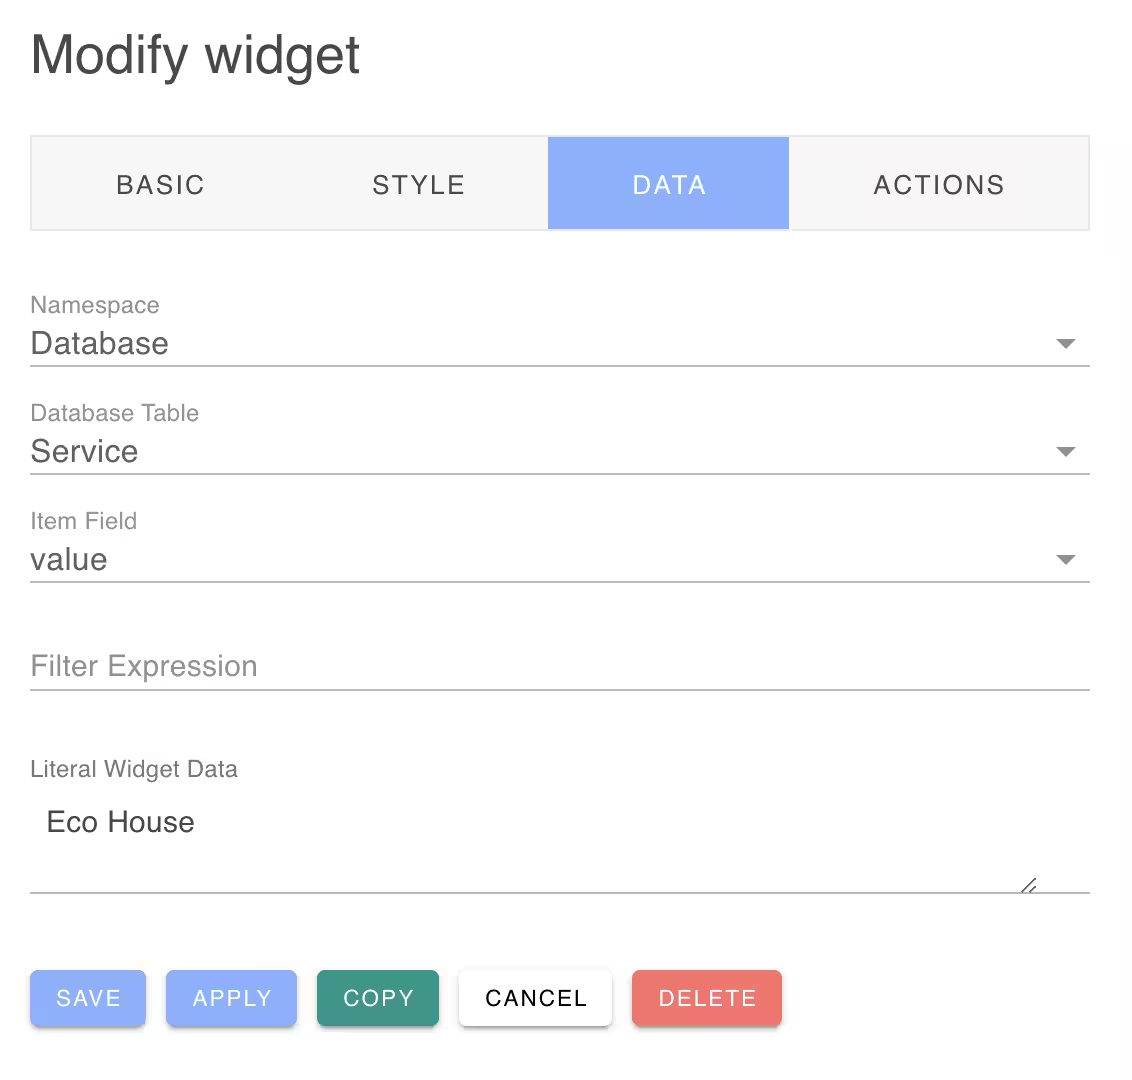
Literal Widget Data
If you are creating a button or text widget, you can specify literal widget data instead of rendering dynamic database or metric data.
Override Date
You can override the default Dashboard date range by providing a widget-specific date range. The period can be set to a range relative to the current time, such as: the last 5 minutes, hour, day, week, month or year. Alternatively, it can be set to a fixed timespan.