Dashboard Toolbar
The Dashboard toolbar provides icons and buttons to modify the dashboard and widget presentation.
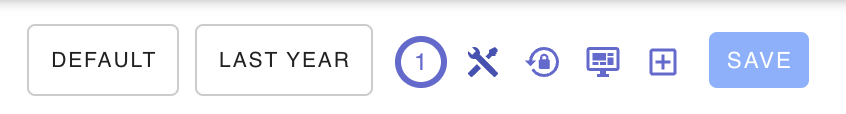
The following fields and icons are provided:
| Icon | Description |
|---|---|
| Dashboard | Selection list of available dashboards |
| Range | Time range for metrics data for widgets |
| Timer | Countdown timer to the next widget data refresh |
| Tools | Enable and disable design mode |
| Reset | Reset the current layout and discard unsaved changes |
| Dashboard | Open the Dashboard Panel to modify the dashboard |
| Plus | Open the Widget Panel to add a new widget to the dashboard |
Time Range
You can customize the time range for the metric data given to dashboard widgets. You can select the period to be per hour, day, week, month or custom period using the Range button.
Timer
Design Mode
The dashboad can be placed in a "design" or "fixed" mode. When in design mode, the dashboard can be modified and widgets can be added, removed, resized and configured. When in fixed mode, all changes are prevented.
Production apps would typically put their dashboards in fixed mode.
When Design mode is enabled, the widget selection toolbox is displayed at the left side of the dashboard and a Dashboard toolbar is displayed at the top.
Reset
Clicking the Reset icon will discard any unsaved changes to the dashboard.
Modify Dashboard
Clicking the Dashboard icon will open the modify dashboard panel.
Add Widgets
Clicking the plus icon will open the Add Widget panel. You can also add widgets by draging a widget from the widget sidebar toolbox.
Expanding Widgets
If you are using the grid layout, you can click an Expand icon in the dashboard toolbar to stretch widgets to the full width of the display and remove redundant white space. This will align widgets on the left and the right of the dashboard. This is useful to quickly align and apportion a grid of widgets.