Dashboards
Dashboards are the window into your device and device cloud state. Dashboards display interactive, graphical information for your account and service.
Dashboards combine interactive widgets to create composite information interfaces that can focus on a particular aspect of your service.
Widgets
Dashboard Widgets render data from the Builder service, Ioto service, and your own custom device metrics.
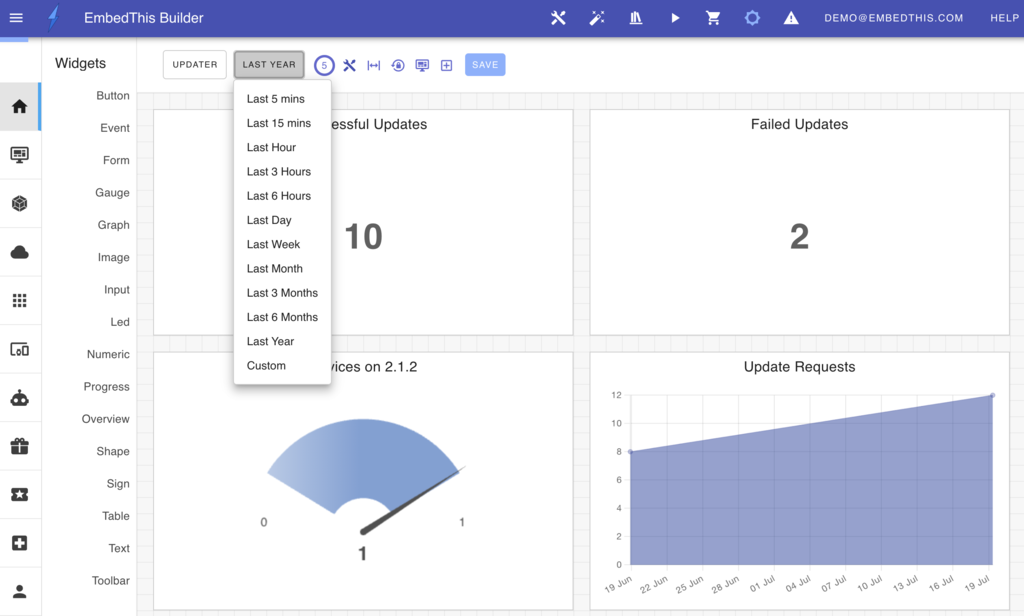
Widgets can be added, removed, styled, positioned, and resized to meet your specific requirements. Dashboards supports 30 different types of widgets, including: gauges, graphs, numeric, text, image, data table and input widgets.
Widgets can dynamically style their colors, backgrounds, fonts, and overall presentation. Widgets can be combined to create cohesive displays that intuitively convey important device and cloud state.
Input widgets such as buttons and switches can invoke actions when pressed or activated by the user. These actions can invoke devices-based commands such as rebooting a device, or perform cloud-based operations such as updating the device database or sending an SMS alert.
Dashboards offer support for:
- Graphical widgets such as graphs, gauges, and numeric and text displays.
- No-code drag-and-drop dashboard and widget designer.
- Customizable layouts with adjustable positioning and sizing of widgets.
- Responsive designs that adapt to various screen sizes.
- Creation of multiple dashboards, each focusing on different aspects of services.
- A gallery featuring additional widgets and data sources.
- The ability to save and share dashboard configurations with team members in your organization.
Dashboards enable you to monitor the performance of your devices and device clouds effectively.
Learn more: