Dashboard Configuration
Using the dashboard configuration panel, you can create, delete and manage dashboards and modify dashboard operation, layout, and styling.
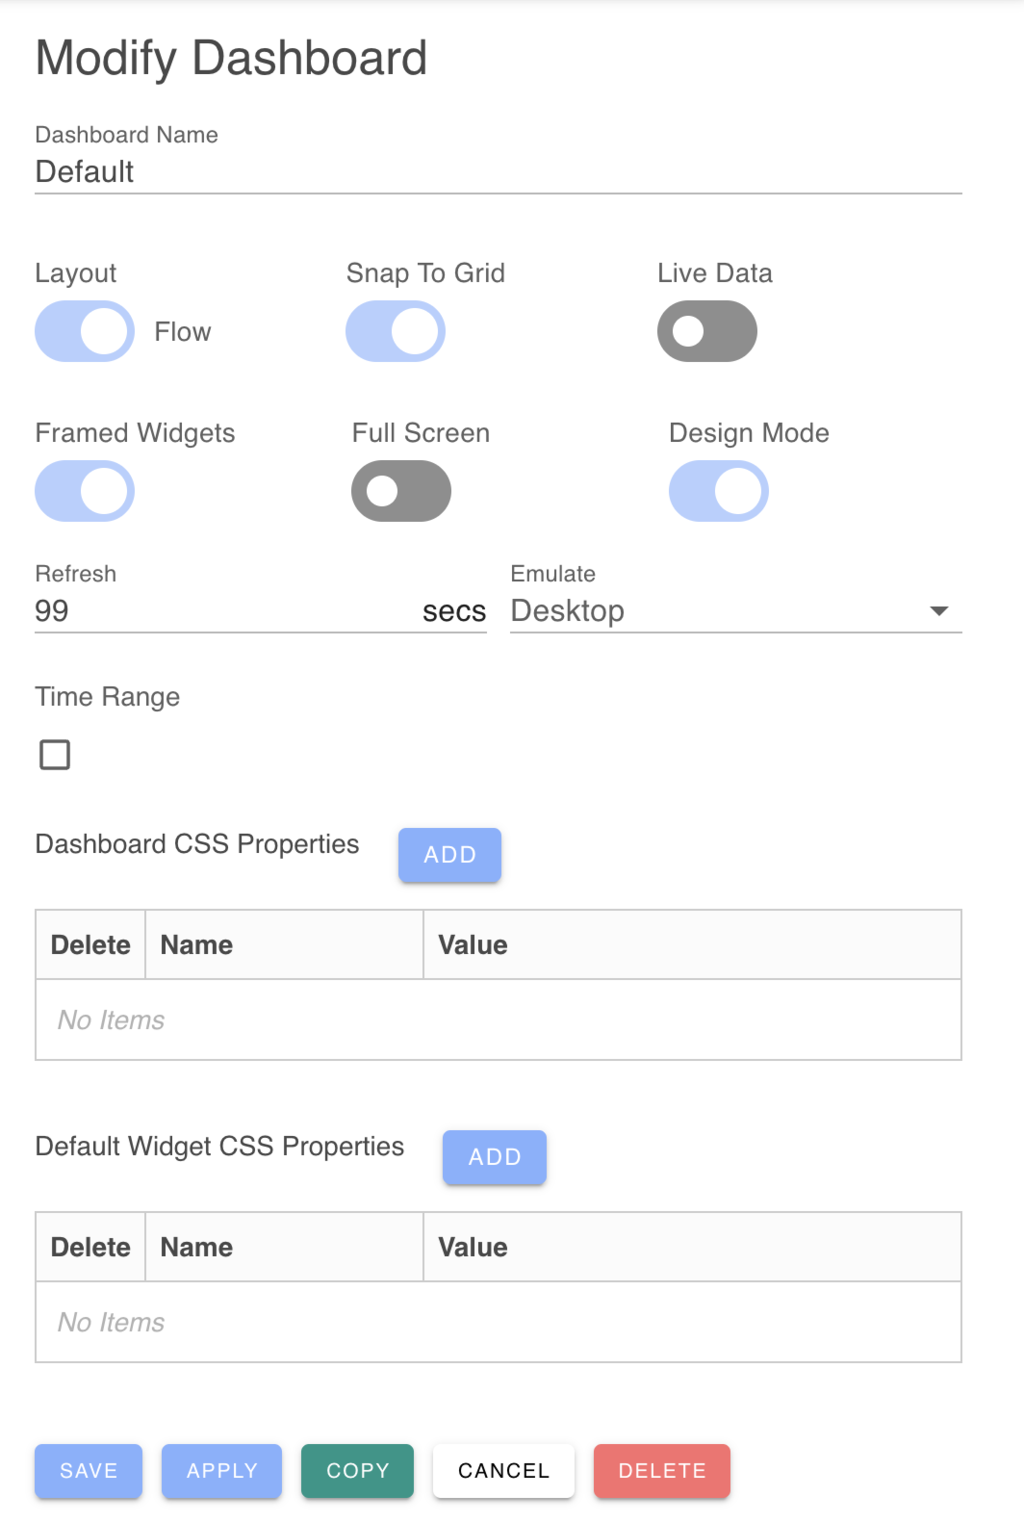
Dashboard Name
Each dashboard is given a unique name that is displayed in the dashboard list.
Dashboard Layout
Dashboards have the choice of using one of two layout engines:
| Name | Description |
|---|---|
| Exact | Layout widgets with exact positioning |
| Grid | Layout widgets on a grid |
Exact Layout
The Exact layout engine will position and size widgets wherever you place and configure them with per-pixel resolution. Widgets can overlap and cover widgets behind them. The exact layout does not use a grid.
The exact layout is useful to create composite pages where widget boundaries are not visible (using frameless widgets).
Grid Layout
The Grid layout will align widgets on a 20 pixel grid.
Live Data
By default, dashboards will automatically update widget data based on the defined Refresh Period. You can disable Live Data update which can help you to focus on styling and arranging widgets without any display updates to break your concentration.
Framed Widgets
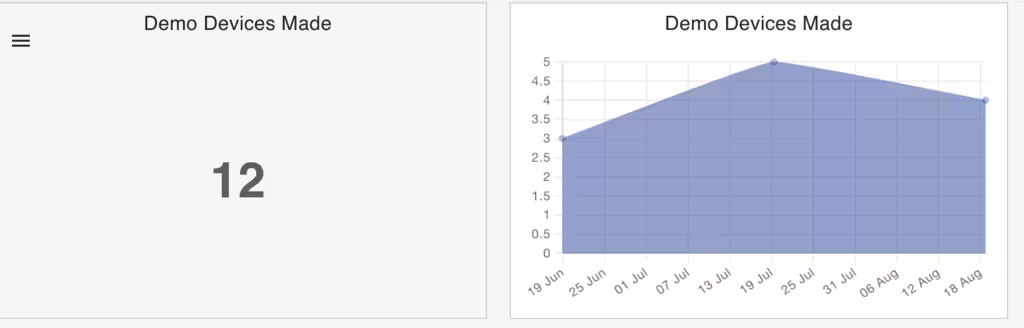
Widgets can be framed with a thin border. If you are creating a dashboard with a grid of data graphs, gauges and metrics, you typically frame the widgets with a consistent border.
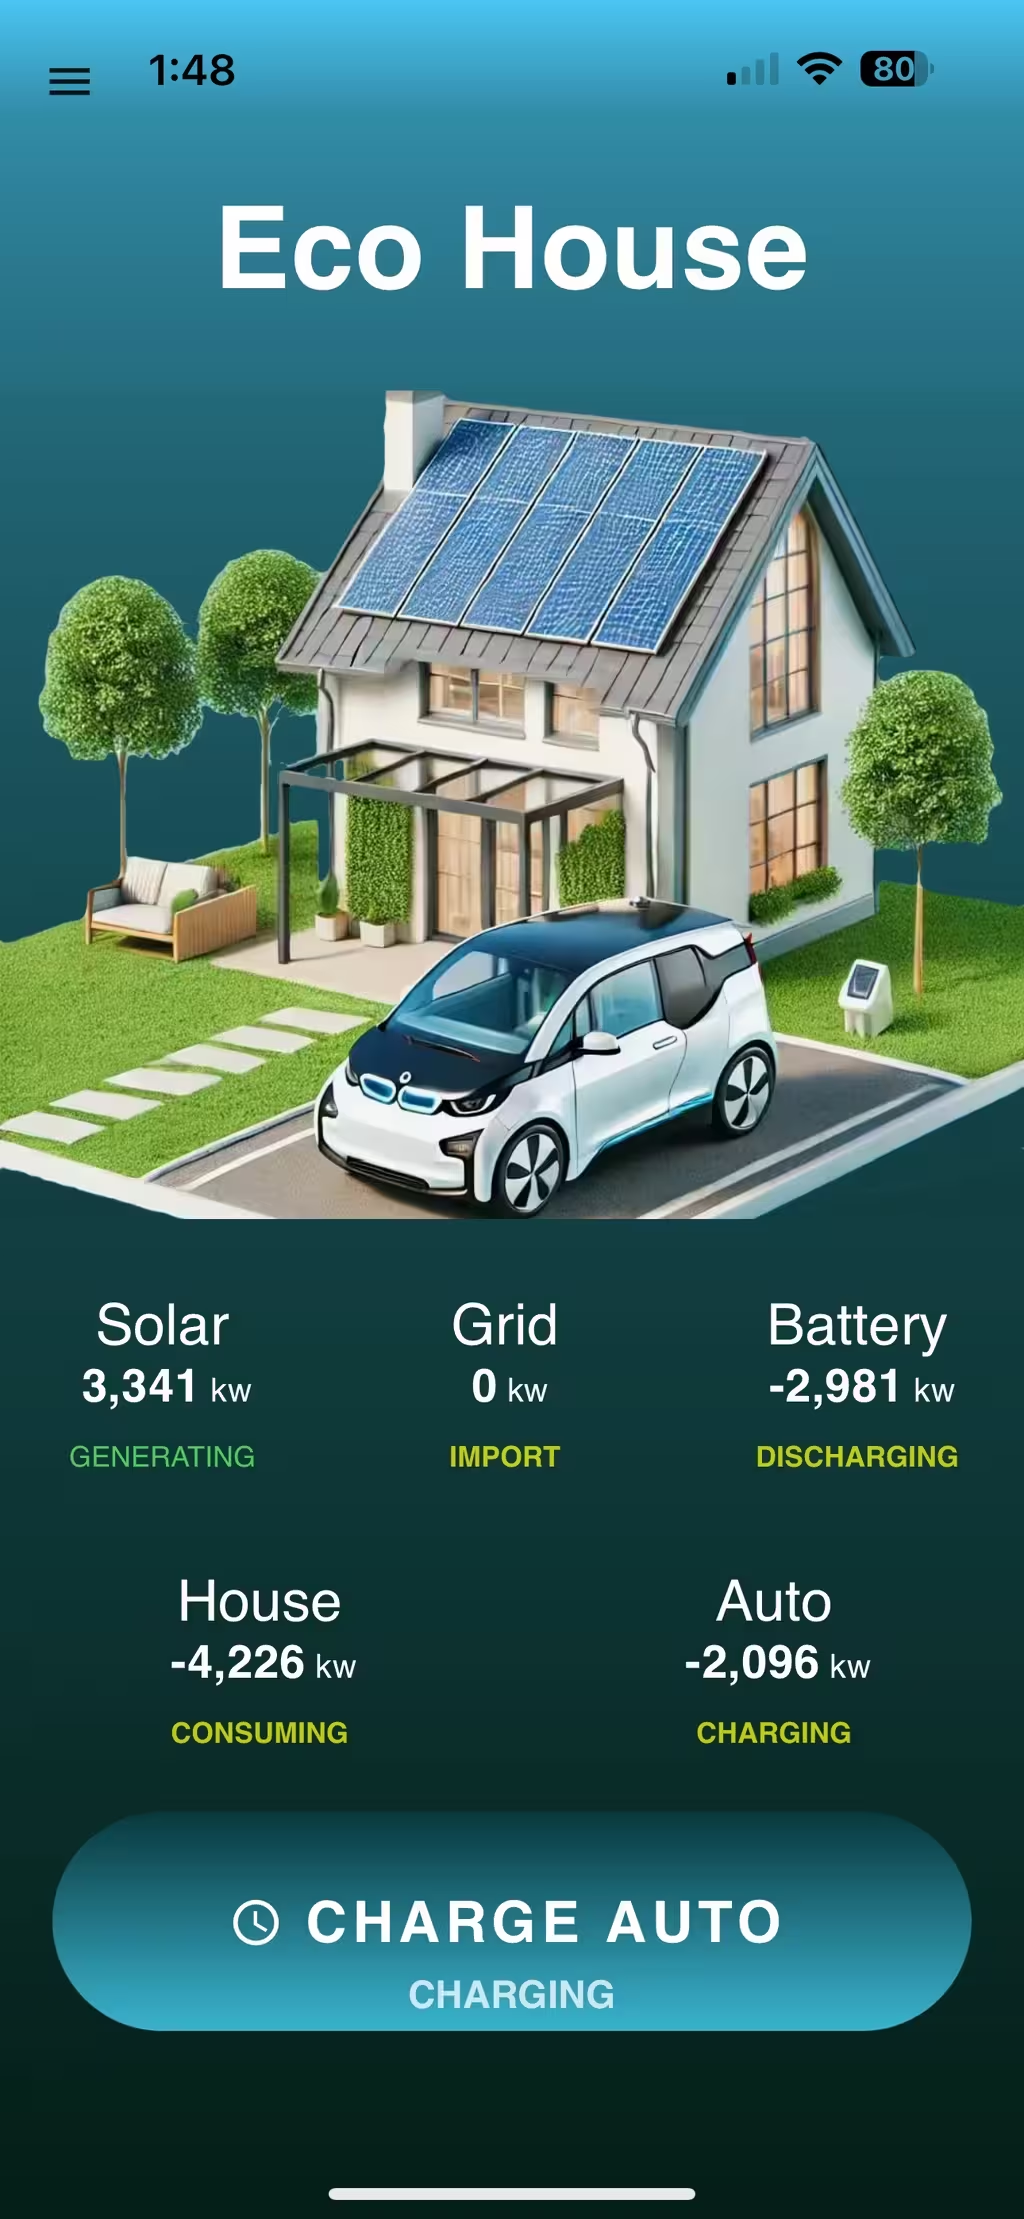
If you are creating a composite page, you may wish to combine widgets so that the boundaries between widgets are less visible. In this case, disabling widget frames can assist to create a cohesive single page interface. For example, the EcoHouse app combines widgets to create a single page dashboard.
In this case, it is typically helpful to enable frames while you are designing a page and then disable frames when you are complete.
Full Screen
When full screen mode is enabled, the normal App navbar is hidden:
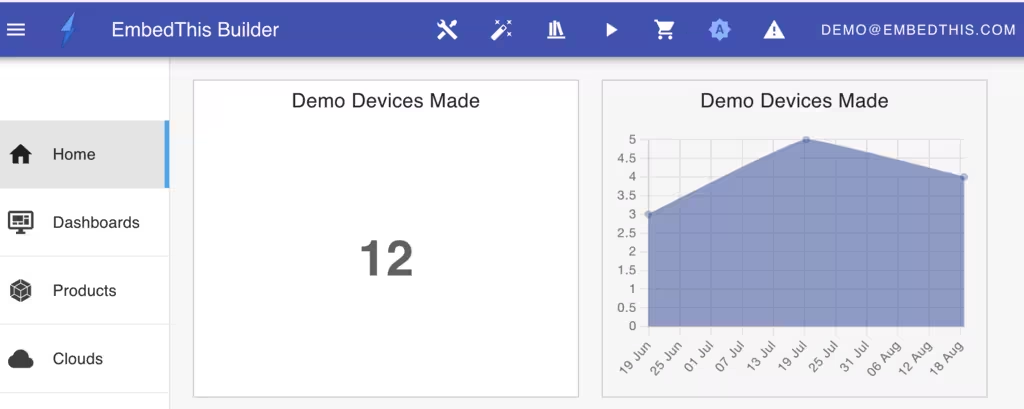
This is useful for mobile displays and for production desktop dashboards.
Design Mode
The dashboad can be placed in a "design" or "fixed" mode. When in design mode, the dashboard can be modified and widgets can be added, removed, resized and configured. When in fixed mode, all changes are prevented.
Production apps would typically put their dashboards in fixed mode.
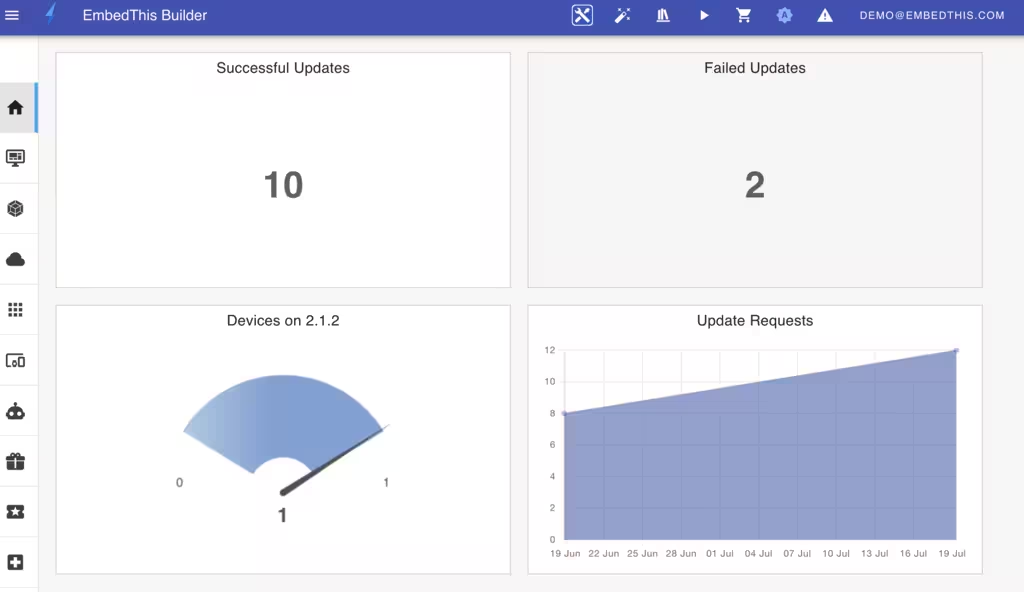
When Design mode is enabled, the widget selection toolbox is displayed at the left side of the dashboard and a Dashboard toolbar is displayed at the top.
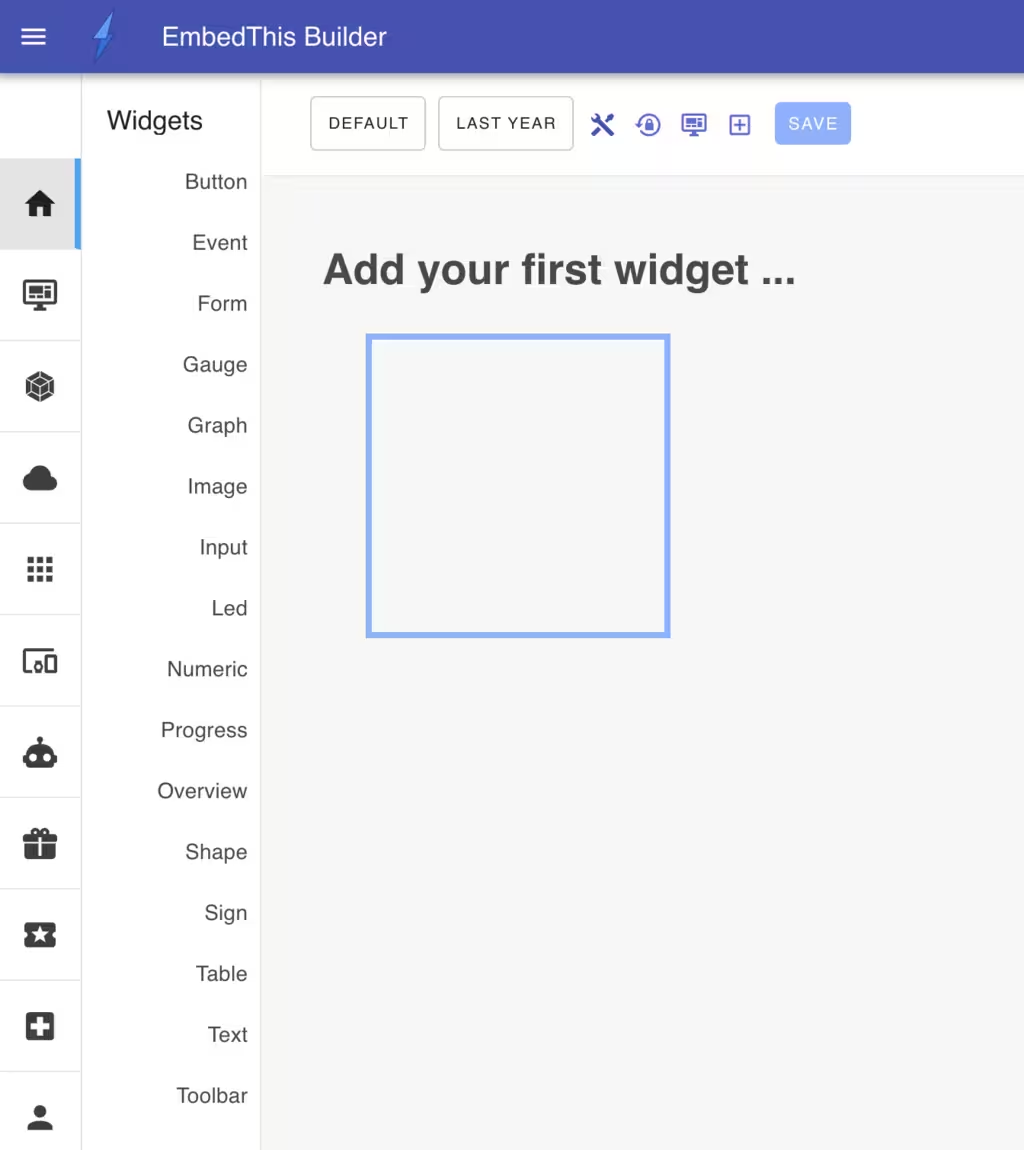
You can enable or disable design mode from the Dashboard toolbar, the App navbar or from the Dashboard edit panel from the Dashboard list.
Refresh Period
You can define the default refresh rate for metrics and data widgets. Set the refresh rate to your desired update period in seconds. However, do not set needlessly low as this will impose increased load on your service.
Device Emulation
When designing pages for a mobile app, it can be helpful to perform your design on a desktop PC and emulate the mobile device. Selecting a mobile device to be emulated will resize the dashboard to be that of an iPhone 15 Pro Max.
Dashboards are responsive and should scale up and down as browser windows are resized or when run on mobile devices of differing dimensions.
Time Range
You can define an absolute or relative time period to use for metric data supplied to your widgets. A relative time range may be set to the most recent number of minutes, hours, days, weeks, months or years. An absolute time range can specify a fixed start and end date.
If the dashboard has a toolbar widget, users can change the time range at any time.
Dashboard CSS Properties
Dashboards can be styled with any valid CSS property. For example, you can set the background to red and foreground color to blue via:
| Name | Value |
|---|---|
| background | red |
| color | blue |
Default Widget CSS Properties
Simlarly to Dashboard CSS properties, you can define default widget properties that are applied to all widgets. These can be overridden per-widget in the Widget edit panel. You can display a color picker by clicking the pencil icon in the table.
Creating and Selecting Dashboards
To create a new dashboard, click "Add Dashboard" from the dashboard list.
When you have finished creating or editing your dashboard, you can Save to persist your changes. You can rename a dashboard by entering a new name and clicking Save.
Click Copy to copy an existing dashboard to a new dashboard. The Apply button saves your changes without dismissing the edit panel. Dashboards can be deleted via the Delete button.
You can create multiple dashboards that focus on different service aspects. For example, you may want a dashboard that features service load graphs and metrics and another dashboard to focus on outages and errors.
You can easily switch between dashboards by clicking on the name of the dashboard in the Dashboard toolbar. You can also, create enable a "dashboard switch" action to a button widget that lets you rapidly switch to another dashboard by clicking a button widget in the dashboard.