What is AWS CloudWatch?

AWS CloudWatch is a unified monitoring service for AWS services and for your cloud applications. It collects and stores operational metrics and log files from resources such as EC2 instances, RDS databases, VPCs, Lambda functions and many other services.
Using AWS CloudWatch, you can monitor your AWS account and resources and generate a stream of events or trigger alarms and actions for specific conditions.
AWS CloudWatch provides visibility into your AWS resources to monitor resource utilization, application performance, and operational health. You can use these insights to manage your application and keep it running smoothly.
Under the Hood
So what is AWS CloudWatch?
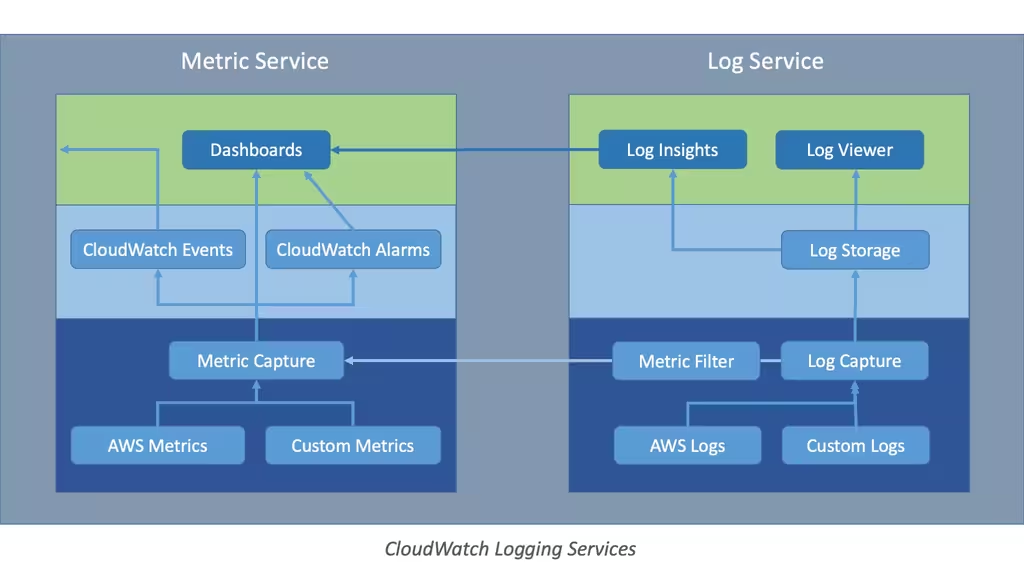
AWS CloudWatch is composed of two distinct services that are promoted under the common name “CloudWatch”.
A Metrics service to capture and manage resource performance and operational metrics.
A Logging service to capture, store and manage service and application logs.
The Metrics service provides resource metric data capture, storage, dashboards, event filtering and alarms. The event service is branded as CloudWatch Events and the alarm service is branded as CloudWatch Alarms.
The Logging service, branded as CloudWatch Logs, provides log data capture, storage, archiving and a basic log viewer and query capability called CloudWatch Logs Insights.

Naming Confusion
CloudWatch is confusing because Metrics and Logs are presented as a single service, when they are in reality two distinct services.
The confusion grows by naming the logging service “CloudWatch Logs” and not naming the metrics service.
Yet more confusion comes from the fact that features within each of these services are given their own brand names: (CloudWatch Events, CloudWatch Alarms and CloudWatch Logs Insights). Add to that, the plethora of AWS names that start with “Cloud” such as CloudFront, CloudSearch, CloudHSM, CloudFormation, CloudTrail and not to forget Cloud9, and you have a bit of a dog’s breakfast.
Surely naming is not Amazon’s strong suit!
Regardless, there are gems underneath and CloudWatch is a critical component in nearly all solutions based on AWS.
CloudWatch Logs Service
AWS Cloudwatch Logs is Amazon’s foundational, unified logging solution for their services and for your applications. It provides log data capture, storage and retention policies with basic management capabilities.
The primary value in CloudWatch Logs is a unified log capture and storage repository. When AWS services emit log data, they utilize CloudWatch Logs as their log service. Having a single, consistent capture and access point for log data is invaluable. Many AWS services create log data that is exported to CloudWatch Logs for storage, including: Lambda, VPC flow logs and RDS.
Applications can send their logs to CloudWatch Logs via the EC2 CloudWatch Agent or directly via the AWS API or CLI. Many logging frameworks have plugins to make this a no-coding proposition.
CloudWatch logs can stream logs to other targets for processing, including to Lambda functions or AWS ElasticSearch.
While CloudWatch Logs does have a simple viewer and query capability, both are basic offerings and most users augment them with 3rd party logging solutions which ingest the CloudWatch Logs data and then provide enhanced visualization and analysis tools.

Log Data
Log data is ingested by CloudWatch Logs as a timestamped message. The message can be formatted as plain text, JSON or any other desired format. CloudWatch Logs has limited understanding of the format of log messages and generally treats the message as plain text.
Logs are stored and accessed via a two level hierarchy of named log groups and streams. These can be thought of as file system folders and files. The logs are regional in scope, i.e. they are stored and accessed via the AWS region in which they were captured. There is no global view of a log across all regions.
A log (group) can specify a retention time after which events will be pruned from the log group. The default is to never expire events which can be costly, especially if logs become somewhat lost when they are scattered around the globe in various AWS regions. For CloudFront logs, this can be a problem as the logs grow quickly and are stored in the region closest to the AWS point of presence serving the content.
CloudWatch Logs Viewer
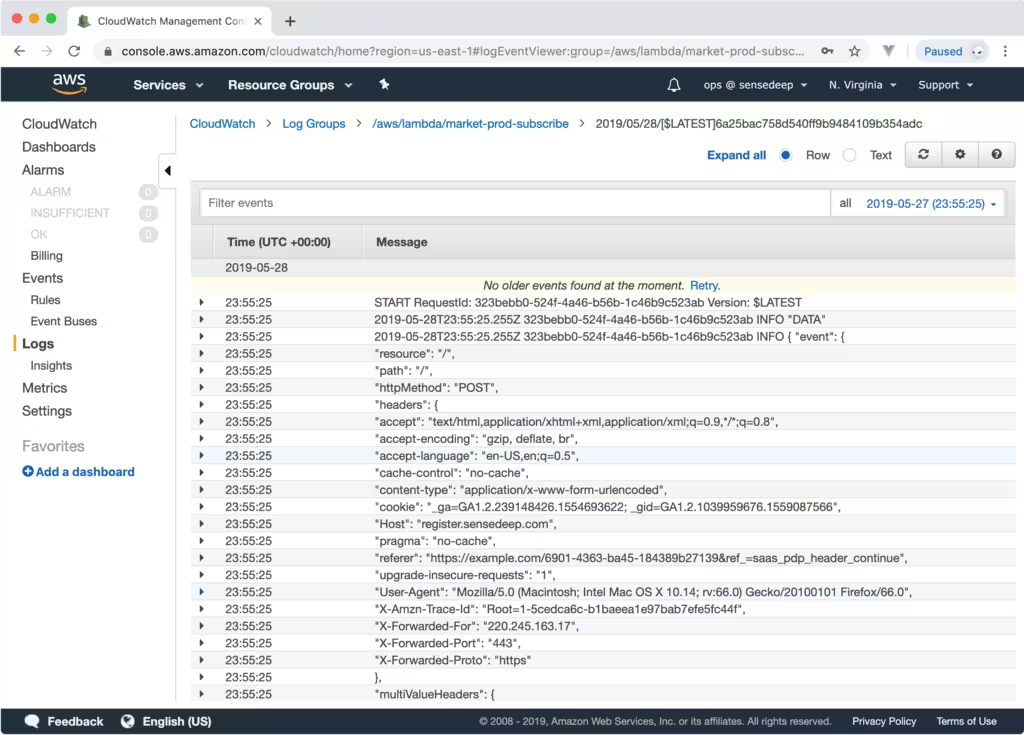
CloudWatch Logs offers a basic log viewer. You can view one page of log events at a time for a single log stream. You must manually select a log stream for display which is a portion of the log event data. AWS will create new streams regularly for many services. For example: each time a Lambda function performs a cold start, a new log stream is created.

Log data is displayed as a timestamp and message with pretty formatting for embedded JSON strings. Log data is rendered one page at a time. You can scroll for more data, but will wait 3-5 seconds for the next page. The Viewer has a text filter so you can filter log data by simple text patterns and a date selector to specify a date range of events. However, the viewer lacks a “live tail” ability to automatically display the most recent log events.
The viewer cannot automatically combine the events from multiple streams within a group. You must examine individual streams in turn to display the desired log events.
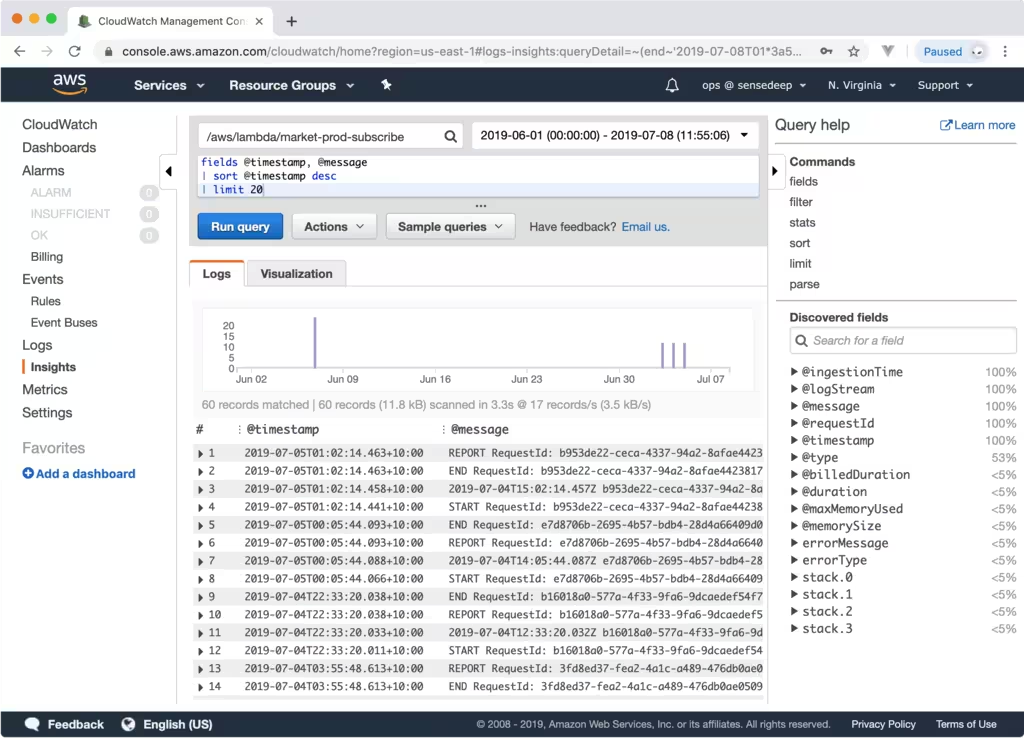
CloudWatch Logs Insights
Insights is an interactive log query tool so you can visualize and analyze log data. Queries can filter and aggregate log data to create time series graphs that visualize log data or publish to CloudWatch dashboards. Insights is a later addition to the CloudWatch Logs service (delivered late 2018).

CloudWatch Metrics Service
The CloudWatch metrics service is comprised of:
- Metrics captured from AWS services, CloudWatch Logs Insights and user applications
- Dashboards that display time series metric data
- Alarms triggered as metric values change
- Streams of events generated as metric values change
Metrics
CloudWatch metrics are time ordered data points published to CloudWatch by AWS services, CloudWatch Logs Insights or user applications. The metrics have a name, timestamp, namespace and zero or more key/value pairs of data.
AWS generates metrics for many of its services including: EC2, EBS, RDS, SQS, SNS. These metrics convey error conditions and performance rates. Some services such as EC2 offer basic metrics for free with detailed monitoring metrics as an option.
Dashboards and Graphs
AWS CloudWatch dashboards are customizable pages that you can configure to monitor your resources from a single location. Dashboards can contain multiple graphs and alarms on a single page and can aggregate metrics from multiple AWS regions.
You can create multiple dashboards for different views into your AWS account.
CloudWatch Alarms
CloudWatch Alarms constantly monitor CloudWatch metrics and alert when a metric or metrics exceed specified thresholds. Alerts can send a message to the AWS Simple Notification Service (SNS) and/or implement simple EC2 and AutoScaling actions. Unfortunately, alerts cannot be sent directly to Lambda functions (yet).
Alarms status can be displayed on CloudWatch dashboards.
CloudWatch Events
The CloudWatch Events service listens for state changes to your AWS resources and creates a stream of events routed to targets for processing. Events are used to proactively notify targets of state changes without resorting to polling. Example events include an EC2 instance being launched or terminated, an AutoScale action or an RDS failover. Example targets include Lambda functions and SNS topics.
Incoming state changes are filtered by rules that match change signatures against an event pattern. After filtering, the event is routed as a stream of events to the designated target.
CloudWatch Events can also generate schedule events. This is useful to run targets such as Lambda functions according to a schedule.
The following recipients can be used as targets of event streams:
- EC2 actions
- Lambda functions and Step Functions state machines
- Kinesis Data Streams
- CloudWatch Logs
- ECS tasks
- Systems Manager Run Command and Automation
- AWS Batch jobs
- Pipelines in CodePipeline
- CodeBuild projects
- Amazon Inspector assessment templates
- SNS topics and SQS queues
- The event bus of another AWS account
CloudTrail
A quick word about CloudTrail as some confuse CloudTrail and CloudWatch. The AWS CloudTrail service is a completely separate service that logs and monitors account activity across your AWS infrastructure. It helps with governance, compliance and auditing your account. CloudTrail provides an event history of your AWS account activity and can send API events to AWS CloudWatch Logs for capture and storage.
Summary
CloudWatch is the foundational basis for management of your AWS infrastructure. It provides a strong capture and storage mechanism for metrics and logs.
While the management tools for viewing and analysis are basic, by augmenting CloudWatch with 3rd party tools, you can easily create a comprehensive monitoring and management platform for your infrastructure.
{{comment.name}} said ...
{{comment.message}}