Dynamic Log Control for Serverless

Serverless apps are an immensely powerful way to build highly scalable and available services. But, serverless apps are also uniquely difficult to monitor, debug and manage due to their distributed components, stateless nature, short execution lifespans and limited access to configuration.
Observability has been popularized as the solution to this dilemma by “instrumenting your functions verbosely” and “wrapping all service boundaries with copious logging”. And … I’m a big fan of real Observability.
However, this can degrade critical production performance and send logging and metric costs spiraling.
So what is the solution?
This post explores a simple, yet effective solution via Dynamic Log Control without compromising Observability.
Observability
Distributed serverless systems need to be easily monitored for current and future failures. To achieve this, such systems need to be “Observable”.
Observability aims to provide granular insights into the behavior of a system with rich context to diagnose current errors and anticipate potential failures. Observable systems integrate telemetry to capture detailed information about the behavior of the system.
Easy you say, just add lots of logging and metrics.
However the painful tradeoff with observability is the hard cost of the telemetry vs the potential benefit of that observability in the future. Each line of instrumentation costs in terms of CPU and log storage. Copious logging can lead to rude performance and cost surprises.
What is needed is a way to minimize the cost of telemetry and to be able to scale it up and down quickly without redeploying.
Of course, you need a strong baseline of logging and metrics so you can have an accurate assessment of your services. But you often need greater insight when digging deep into an issue.
Dynamic Log Control
Serverless apps pose challenges for the dynamic scaling up and down of logging.
Serverless functions are ephemeral. They are not like an EC2 server or long lived docker applications. They often last only milliseconds before terminating. They keep little or no state and fetching state from a database may be too great an overhead to incur on every function invocation.
However, there is a technique that can be adapted for dynamic log control that is well proven and understood: Good Old Environment Variables.
Environment Control
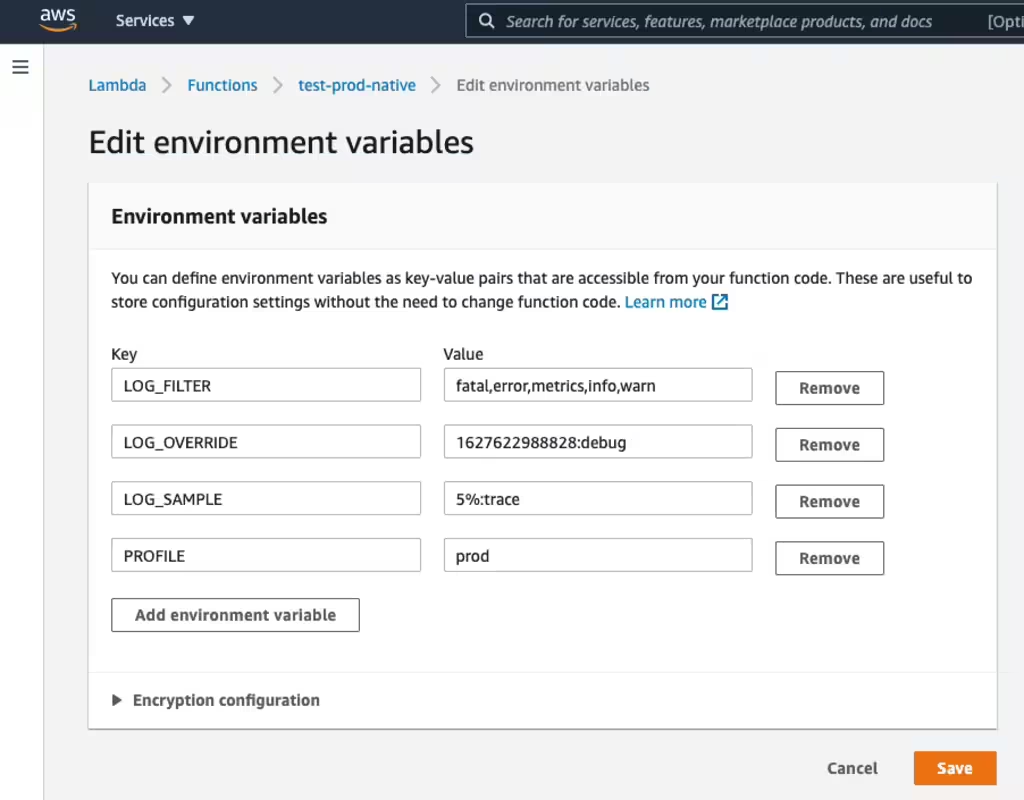
When AWS Lambda loads a function, it provides a set of environment variables that can be read by the function with zero delay. Via these variables, you can provide log control instructions to vary the amount and focus of your logging.
Here is the AWS console’s Lambda environment configuration page.

If you change the environment variables (without redeploying or modifying your function), your next invocation will run with the new environment values.
So using special LOG environment variables, we can communicate our desired log level, filtering and sampling, and have our functions respond to these settings without modifying code or redeploying. Sweet!
What are the downsides: Changing environment variables will incur a cold-start the next time the functions are invoked, but that is typically a short, one-off delay.
Log Control
To control our logging, we propose three log environment variables:
- LOG_FILTER
- LOG_OVERRIDE
- LOG_SAMPLE
Depending on your log library (SenseLogs, Pino, Winston, …) you specify your log level or channel via these variables.
The LOG_FILTER defines log level. Enabled levels will emit output. Disabled levels will be silent. For example:
LOG_FILTER=5
or if you are using SenseLogs you specify a set of log channels.
LOG_FILTER=error,warn
This will enable logging output in your Lambdas for log.error() and log.warn() but disable output for calls to trace or debug.
The LOG_OVERRIDE will replace the LOG_FILTER for a given period of time before reverting to the LOG_FILTER settings. LOG_OVERRIDE is prefixed with an expiry time expressed as a Unix epoch in milliseconds since Jan 1 1970.
For example:
LOG_OVERRIDE=1629806612164:5

or

LOG_OVERRIDE=1629806612164:debug,trace
The LOG_SAMPLE is a sampling filter that applies to a given percentage of requests. The list of levels is is prefixed with a percentage.
For example, this will trace 5% of requests.
LOG_SAMPLE=5%:trace
Logging Libraries
This technique will work with Node, Python and Java Lambda functions. It is easy to configure with most popular log libraries including: Bunyan, Debug, Pino, SenseLogs or Winston.
An ideal logging library will permit custom levels so that latent logging code can be embedded in your function without incurring a run-time overhead for most invocations. When required, you can add that custom level to your LOG_FILTER or LOG_OVERRIDE and turn on that custom log output. Custom levels should be able to be enabled and disabled without impacting other levels.
It is very important that your logging library has extremely low overhead for disabled log levels. Otherwise, the benefit of dynamically scaling is lost.
Implementations
I’ve included below some examples for NodeJS using the SenseLogs and Pino logging libraries.
To see code samples for Bunyan, Debug, Winston or Python please checkout our Dynamic Logging Samples which has detailed code samples for each library and Python using these techniques.
Also available via GitHub gists at: Dynamic Log Control Gist
Controlling SenseLogs
Here is a sample of how to use this technique with SenseLogs which has builtin support to respond to the LOG_FILTER, LOG_OVERRIDE and LOG_SAMPLE environment variables. SenseLogs is an extremely fast serverless logger that supports custom log channels. It has almost zero cost for disabled log levels.
import SenseLogs from 'senselogs'

let log = new SenseLogs()

exports.handler = async (event, context) => {
    //  This will be emitted if LOG_FILTER contains 'debug' as a log level
    log.debug('Hello world')

    //  EMF metrics can also be dynamically controlled
    log.metrics('trace', 'AcmeRockets/CriticalLaunchFailure', {explosion: 1})
}
Learn more at Serverless Logging with SenseLogs.
Controlling Pino
Here is a sample of how to use the popular Pino general purpose logger.
This sample uses a small amount of code to parse the LOG environment variables and setup the Pino logger.
import Pino from 'pino'

let {LOG_FILTER, LOG_OVERRIDE, LOG_SAMPLE} = process.env

if (LOG_OVERRIDE != null) {
    let [expire, level] = LOG_OVERRIDE.split(':')
    if (level && Date.now() < expire) {
        LOG_FILTER = level
    }
}
let sample = 0, sampleRate, sampleLevels
if (LOG_SAMPLE != null) {
    [sampleRate, sampleLevel]s = LOG_SAMPLE.split(':')
}

const pino = Pino({name: 'pino', level: LOG_FILTER})

exports.handler = async (event, context) => {
    if (sampleRate && (sample++ % (100 / sampleRate)) == 0) {
        //  Apply the sample levels
        pino.level = sampleLevel
    }
    pino.debug('Debug message')
}
Managing Log Configuration
When you have an important issue to diagnose, you can now scale up your logging by setting the LOG_OVERRIDE environment variable to increase the log level for a period of time. Depending on your log library, you may also be able to focus your logging on a specific module by using custom levels.
You can modify your environment configuration via API, the AWS Console or via the AWS SDK.
AWS CLI
The AWS CLI has support to update the function configuration using update-function-configuration.
For example:
EXPIRES=$((($(date +%s) + 3600) * 1000))
aws lambda update-function-configuration --function-name MyFunction \
    --environment "Variables={LOG_OVERRIDE=${EXPIRES}:error,info,debug,trace,commerce}"
This calculates an expiry time and overrides the log levels for one hour to include the error, info, debug and trace levels and the custom commerce level.
AWS Console
You can also change these environment values via the AWS console.
Simply navigate to your function, select Configuration then Environment Variables then Edit and modify then save.

Summary
Using this technique, you can easily and quickly scale up and down and focus your logging as your needs vary. You can keep a good base level of logging and metrics without breaking the bank, and then increase logging on-demand.
More?
The logging library code samples are available at Log Control Samples.
SenseLogs is available from GitHub SenseLogs or NPM SenseLogs.
{{comment.name}} said ...
{{comment.message}}