Ioto IoT Analytics and Metrics

The foundation for providing detailed IoT analytics is comprehensive and accurate device data coupled with flexible and extensive metrics.
Ioto offers comprehensive IoT Analytics power by detailed per-device IoT metrics that monitor all aspects of your devices and fleet.
IoT Device metrics are data measurements pertaining to individual devices or their collective performance. These metrics offer essential insights into the operational and functional aspects of your devices and fleet. For example, you may create a metric representing a device’s internal power supply temperature.
Ioto IoT device metrics can be queried and visualized by device management apps via customizable dashboards, graphs and widgets. This makes it easy to monitor the performance and health of devices. You can query device metric values in real-time or examine historical values.
Ioto IoT Device Metrics Features
Ioto metrics support the following features:
- Automatic metric creation from device data streams.
- Aggregation of metric values over multiple devices for fleet-level metrics.
- A granular metric model for supporting namespaces, metrics, dimensions, statistics and intervals.
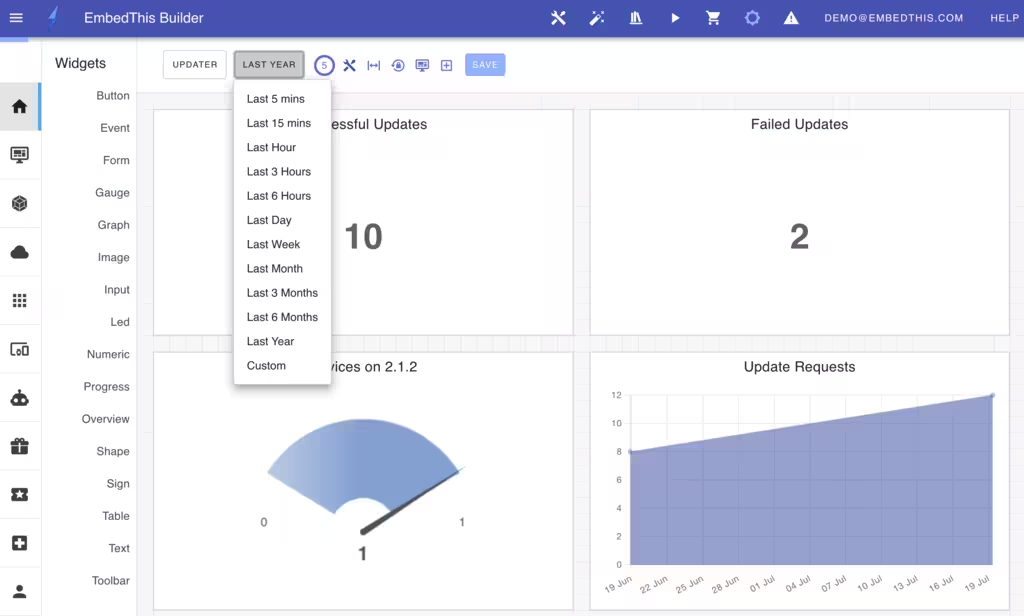
- Display of current or historical data for the last 5 minutes, 1 hour, 1 day, 1 week, 1 month or 1 year.
- Compution of statistics for: average, min, max, count and sum.
- Scalable metrics engine supporting very large numbers of simultaneous devices emitting metrics.
Ioto IoT device metrics are collected in real-time, allowing the ability to immediately monitor the behavior of devices and to observe historical device behavior. The Ioto device cloud service will retain device metrics for up to one year by default.
Creating Metrics
Device metrics can be created two ways:
- Implicitly as specified by the device data schema.
- Explicitly by API in the device agent.
Device Schema Metrics
IoT metrics can be created implicitly by defining metric rules in the device data schema. As data is sent from device to the cloud, the Ioto service uses the rules to create metric data points for matching data items.
In the device data schema, you can specify a list of metrics to be created via the schema processing instructions. For example:
{
    process: {
        Params: {
            metrics: [ {
                fields: ['cpu', 'temperature'],
                dimensions: [{Device: 'deviceId'}]
            } ]
        }
    }
}
When the device sends an update to the Params table, the Ioto service will automatically extract the cpu and temperature fields and create corresponding metrics. The metric will have multiple dimensions – one for each device (ID).
Read more about device schemas in the Ioto Schema Documentation.
You can also download the default device schema from Ioto Default Schema.
IoT Analytics
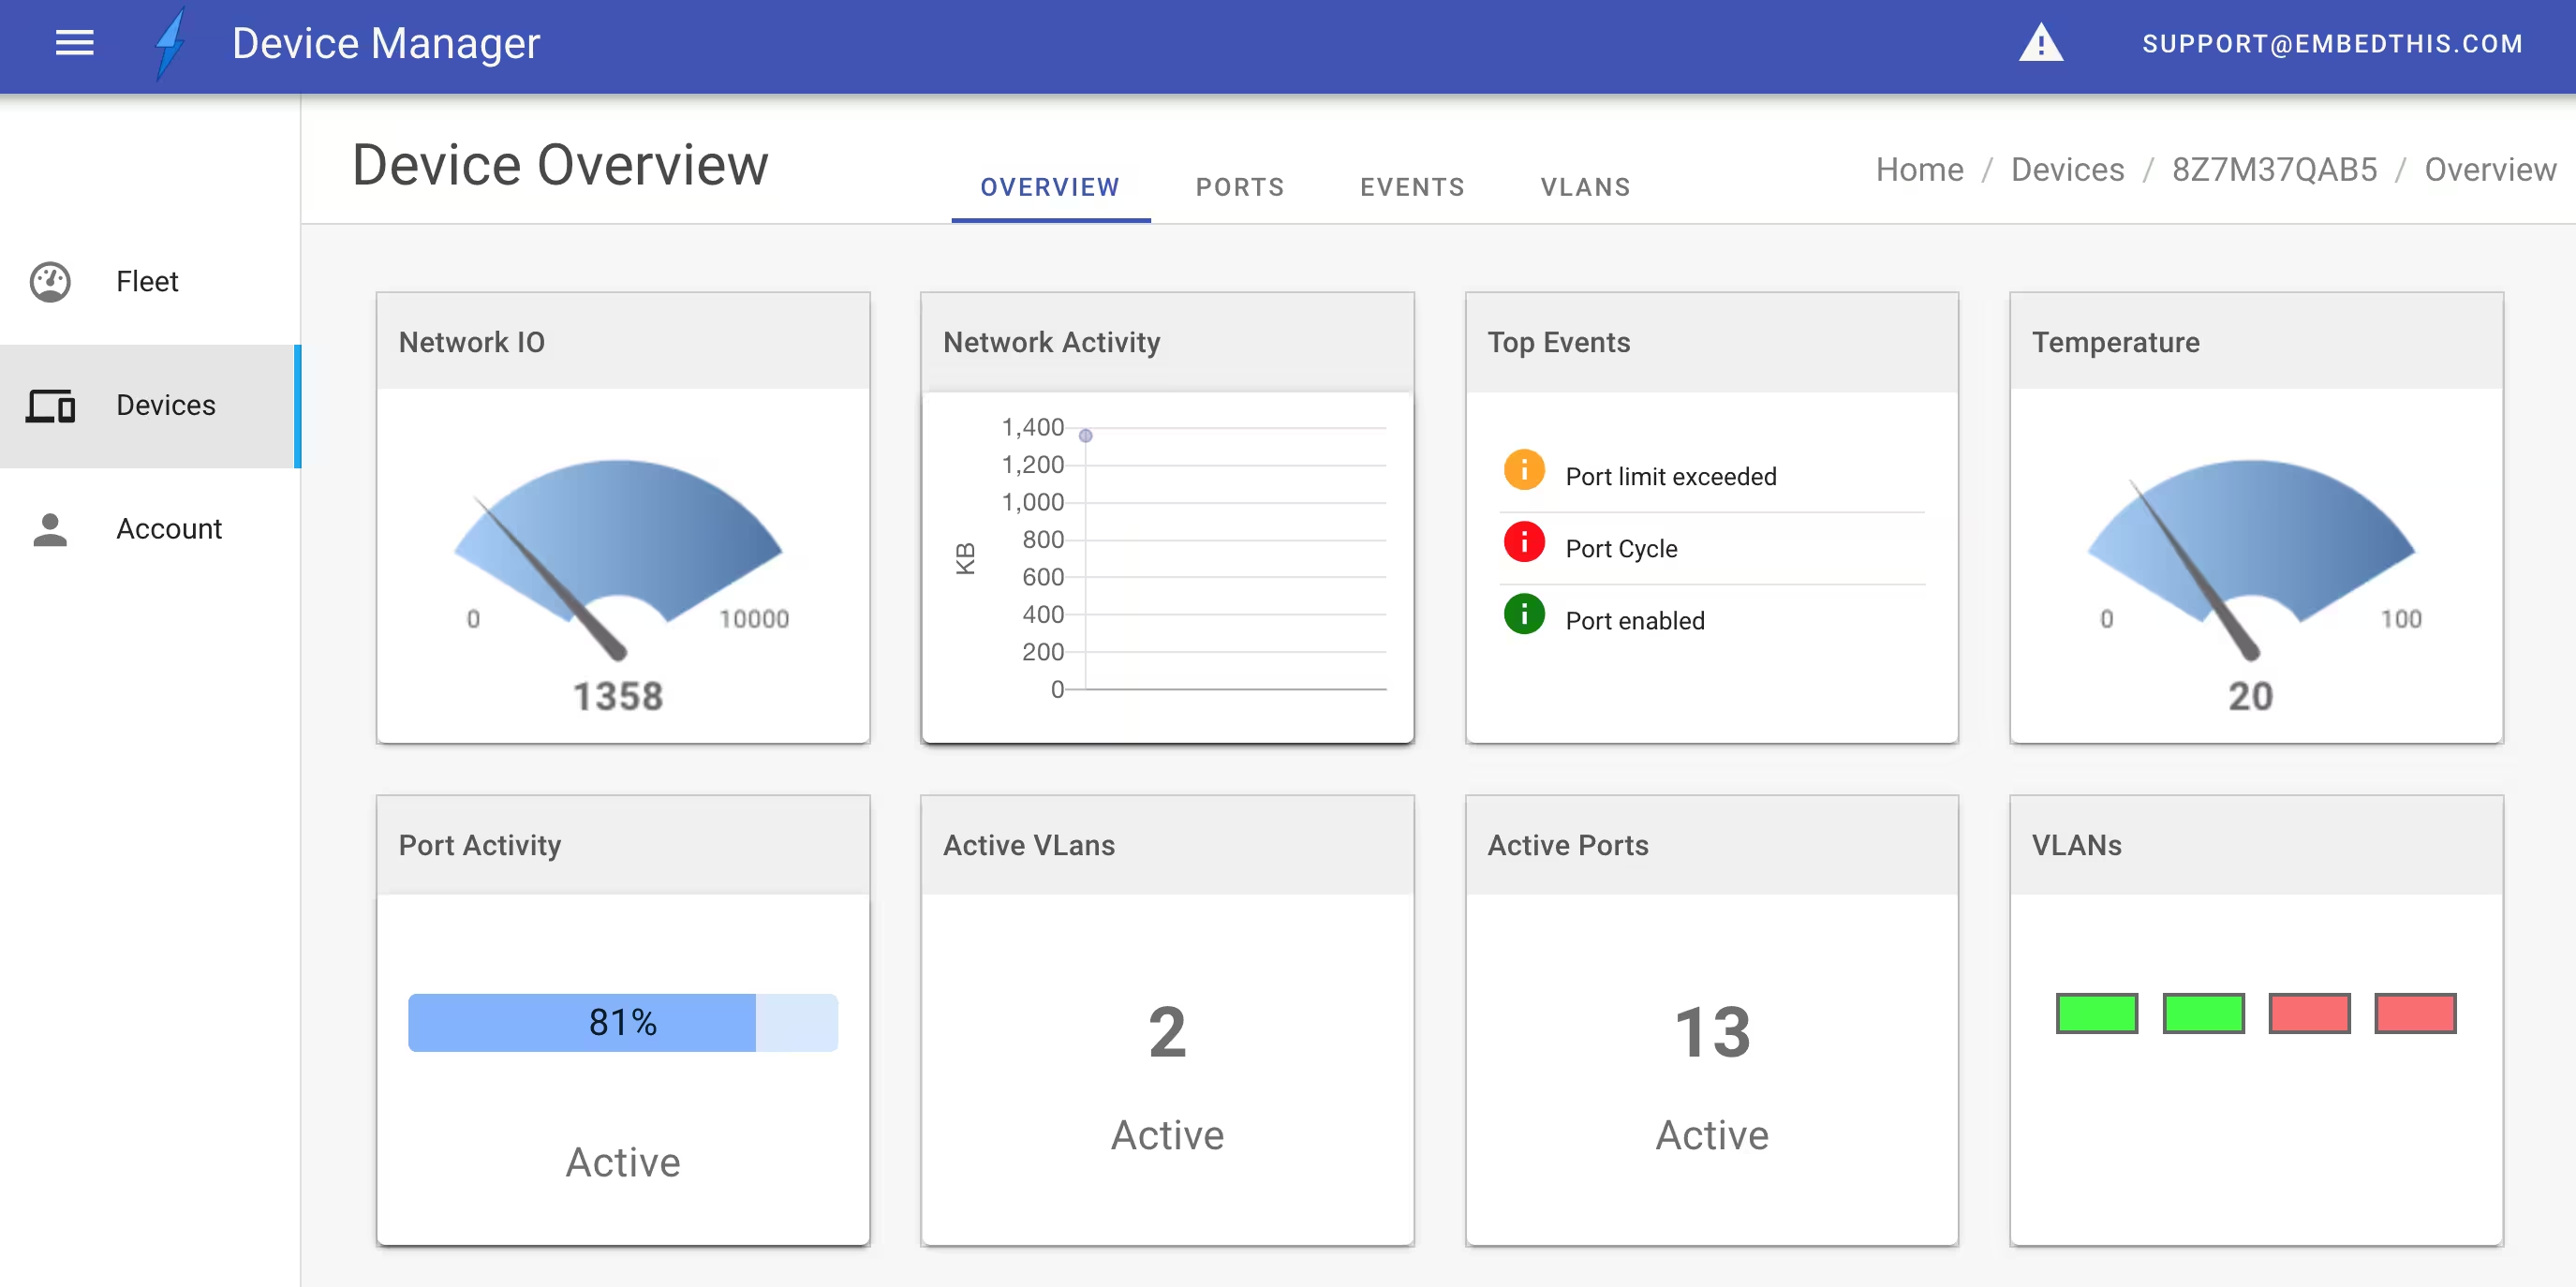
Ioto device metrics can be queried and visualized using Ioto Device Apps via dashboards, graphs and widgets.
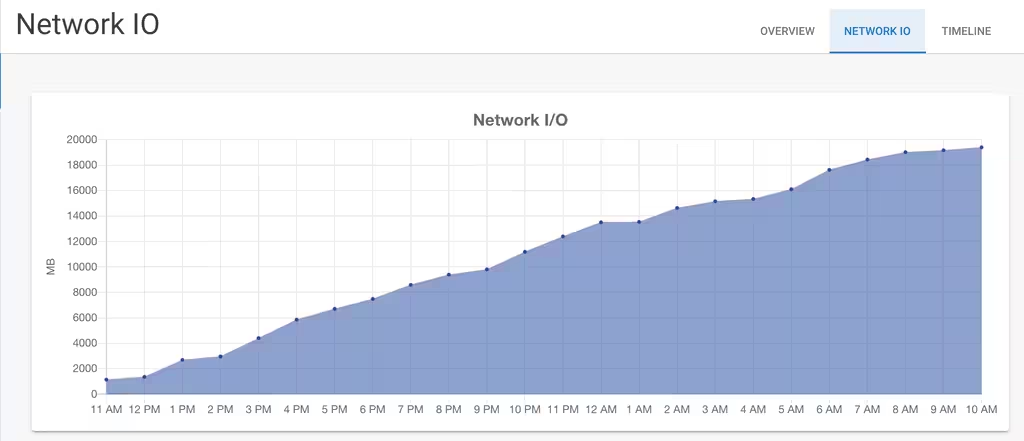
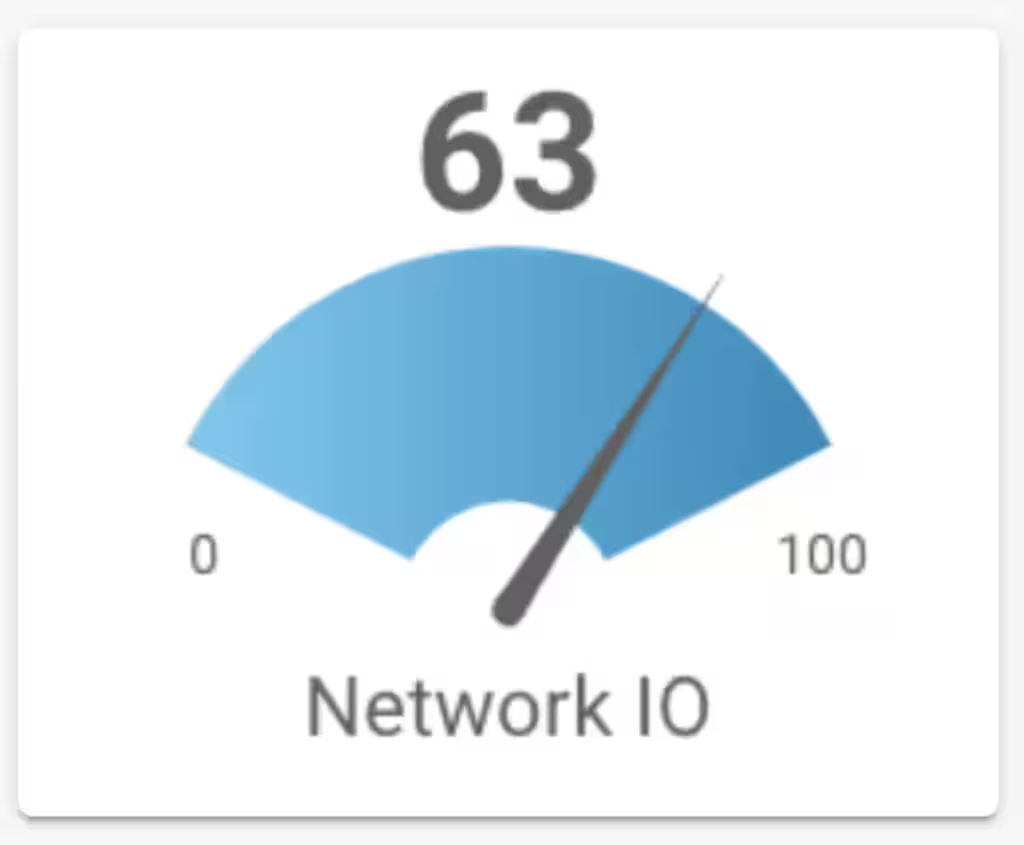
The graphical widgets can display IoT Analytics as:
- Graphs
- Gauges
- Tables
- Numeric values
Widgets can display current metric data or historical data. When displaying historical data, you can choose the last 5 minutes, 1 hour, 1 day, 1 week, 1 month or 1 year to view data trends over time.
Graph Widget

Gauge Widget

Dashboard of Widgets

Metric Storage
Ioto efficiently stores each device metric in a single, compressed database item. Each metric stores the optimized data points for the metric’s historical timespans (5 mins, 1 hour, 1 day, 1 week, 1 month and 1 year).
Optimized Metrics
To optimize the data load imposed for high frequency metrics, you can elect to buffer metric upates. This will aggregate separate data points into fewer composite values. This can significantly optimize your metric performance.
For example:
{
    process: {
        Store: {
            metrics: [ {
                fields: [{CPU: 'value'}],
                where: 'key == "cpu"',
                dimensions: [{Device: 'deviceId'}]
                buffer: {count: 60, elapsed: 60}
            } ]
        }
    }
}
This example will buffer metric updates in-memory until there have been 20 data points, or 60 seconds has elapsed, whichever is reached first.
This example also demonstrates how to create metrics from data sent to the key/value Store table. The metric CPU is created from the value field for items where the key field is equal to “cpu”.

Why not AWS CloudWatch Metrics?
Given that the Ioto cloud service is built upon the AWS platform, you may wonder why not just use AWS CloudWatch Metrics? The simple reason is that while AWS CloudWatch does offer a comprehensive metric service, many users find that CloudWatch is one of the most expensive parts of their AWS bill. For a metric that is regularly updated or queried, the cost amounts to $0.30 per metric per month. If each device has 10 metrics, the would equate to a $36 bill per year, per device! With 10,000 devices, the total bill would be $360,000.
Ioto Analytics and Metrics are a much more cost-effective solution tailored for the needs of IoT device management. An individual device can have a large number of metrics and the total cost is a tiny fraction of the cost of AWS CloudWatch Metrics.
Want More Now?
To learn more about the EmbedThis Builder, please read:
{{comment.name}} said ...
{{comment.message}}