Builder and Device App Dashboards
The Builder portal and device apps now feature enhanced smart dashboards, equipped with a new responsive layout engine and improved widget presentation. These dashboards use graphical widgets to display essential information, allowing you to design intuitive and engaging interfaces that highlight critical data effectively.
The smart dashboards are fully responsive so you can design interfaces that scale and adapt to the user’s current browser configuration while keeping graphical elements and widgets aligned for the most graphically appealing presentation.
Furthermore, these dashboads can be extensively customized to display data and metrics for your devices so you can efficiently monitor your devices clouds, ensuring optimal performance and oversight.
Dashboard Features
- Graphical widgets, including graphs, gauges, and numeric and text displays.
- Customizable layouts allowing for adjustable positioning, ordering, and sizing of widgets.
- Easy widget positioning and alignment through options like snap-to-grid, compact, and expand layouts.
- Responsive layouts that adjust to different screen and window sizes.
- Dark mode designs that follow user’s dark mode preferences.
- The capability to create multiple dashboards, each tailored to specific service aspects.
- A gallery that offers additional widgets and data sources.
- A collection of pre-configured widget sets designed for various AWS services.
- Options to save and share dashboard configurations with colleagues within your organization.
These dashboards are extremely adaptable; you can design multiple dashboards, each focusing on different operational facets of your device clouds and device fleets.
Dashboard Toolbar
Dashboards can be modified at any time via the dashboard toolbar.
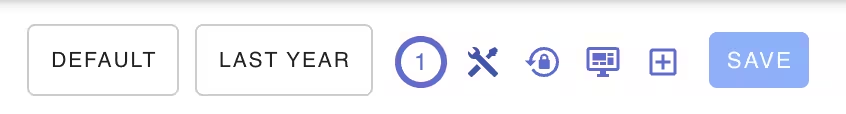
The following operations are provided:
| Icon | Action |
|---|---|
| Pencil | Access the Dashboard Panel to edit the dashboard |
| Timer | Countdown to the next data refresh for widgets |
| Compact | Compress the current widgets to eliminate excess space |
| Expand | Stretch widget rows to utilize the available space in the browser window |
| Reset | Restore the original layout and discard any unsaved changes |
| Plus | Open the Widget Panel to add a new widget to the dashboard |
Adding Widgets
To add widgets to the dashboard, click on the add widget square+plus icon that will display the widget slide-out panel. From this panel, you can select your widget type and the wizard will then prompt for the required fields.
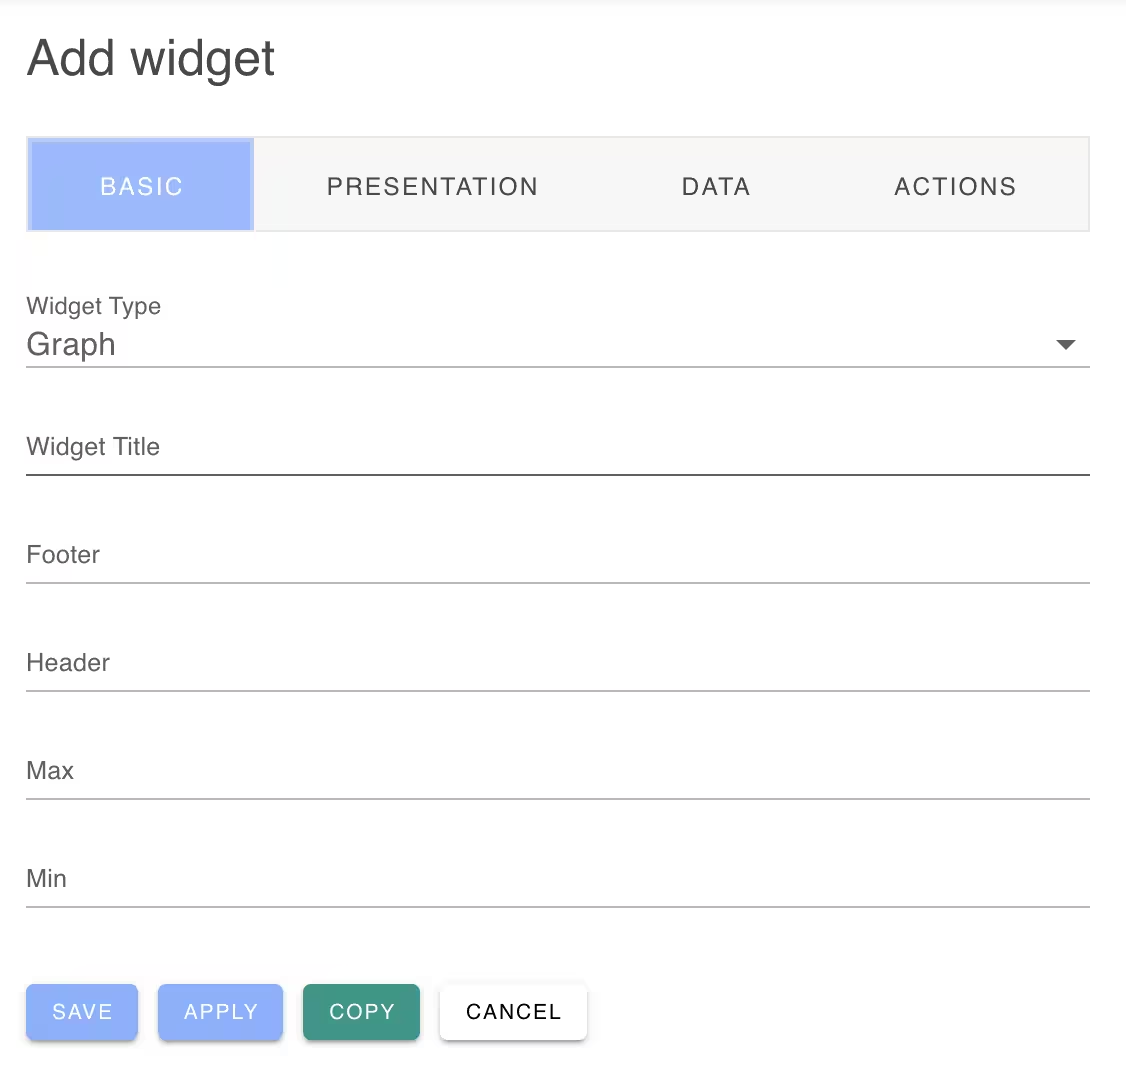
Dashboards supports a variety of widget types including: gauges, graphs, numeric and text widgets.
If you have created a Dedicated Device Cloud, you can select a service overview, you can choose from overviews for AWS billing, CloudWatch, DynamoDB, EventBridge, Lambda, SES or SNS.
Layout
You can adjust the layout of the dashboard by moving and resizing widgets. To move a widget, click and drag it from the title area to a new location. To resize a widget, click and drag the resize handle located at the bottom left corner to your preferred size. As you move or resize widgets, the dashboard automatically rearranges other widgets to prevent overlap and ensure clear visibility. To remove a widget, click the (x) icon in the top left corner of the widget.
Snap to Grid
The Dashboard will align widgets to a 20 pixel grid when the Snap to Grid dashboard option is selected in the dashboard panel. New dashboards will by default enable the grid.
After creating a dashboard, it is useful to deselect the “Snap to Grid” option so that the dashboard and widgets will be fully responsive and remain aligned if the browser window is resized.
Compacting Widgets
The compact icon will compact widgets and remove extra space. If your dashboard is using the “Snap to Grid” option, the widgets will be aligned on the 20 pixel grid.
Expanding Widgets
The “Expand widget” feature stretches each row of widgets to fill all the available space, overriding the grid so that the widgets are aligned at the right of the display. After using this feature, it may be beneficial to turn off the dashboard’s “Snap to Grid” option to maintain this alignment.
Zooming a Widget fo Full Size
If you double click a widget, it will be zoomed to full screen display. Click escape or click the “X” on the top-right of the widget to restore it to normal size.
Resetting the Dashboard
When the reset icon is clicked, all unsaved changes will be discarded.
Resizing the Window
When you adjust the size of your browser window, the dashboard will automatically expand or contract as needed. If the Snap to Grid option is disabled, the widgets will be fully responsive and maintain their alignment and relative positions.
As a best practice, it’s recommended to enable “Snap to Grid” during the design process and then disable it before saving the dashboard. This approach ensures that your preferred widget layout is preserved, regardless of changes in browser window size.
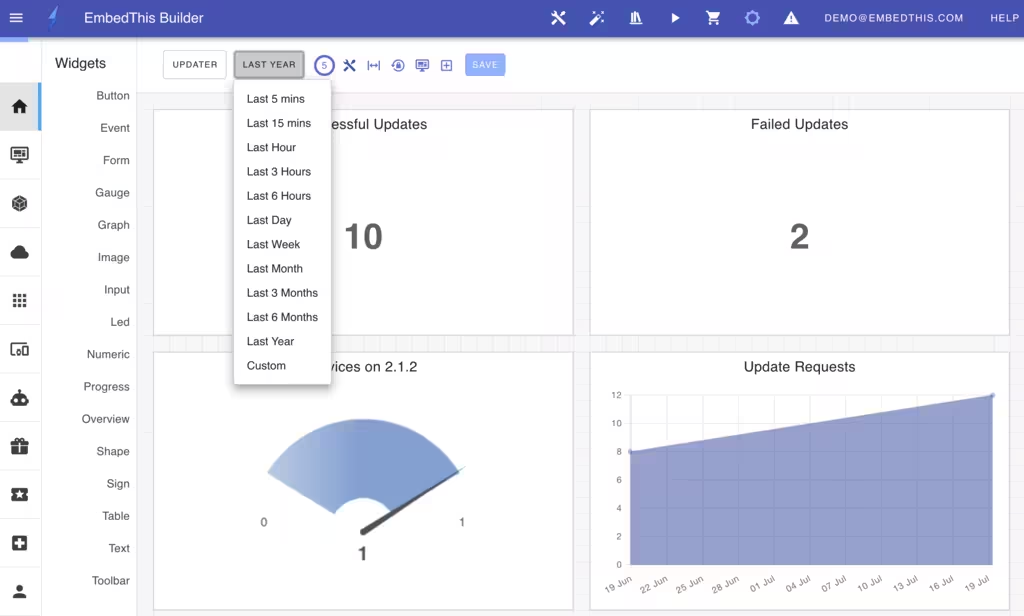
Widget Data Period
You can customize the data period for the graphs and metrics displayed on the dashboard. At the top center-right of the page, you can select the period to be per hour, day, week, month or custom period using the period button at the top right.
Saving and Sharing
Dashboards may be saved and shared among team members.
When you make a modification to the dashboard such as resizing a widget or moving its position, a “Save” button will appear. Clicking save will persist the layout and set it as the new default layout for you and all other team members.
Creating and Selecting Dashboards
You can create multiple dashboards that focus on different service aspects. For example, you may want a dashboard that features service load graphs and metrics and another dashboard to focus on outages and errors.
You can easily switch between dashboards by clicking on the name of the dashboard in the top left of the home page.
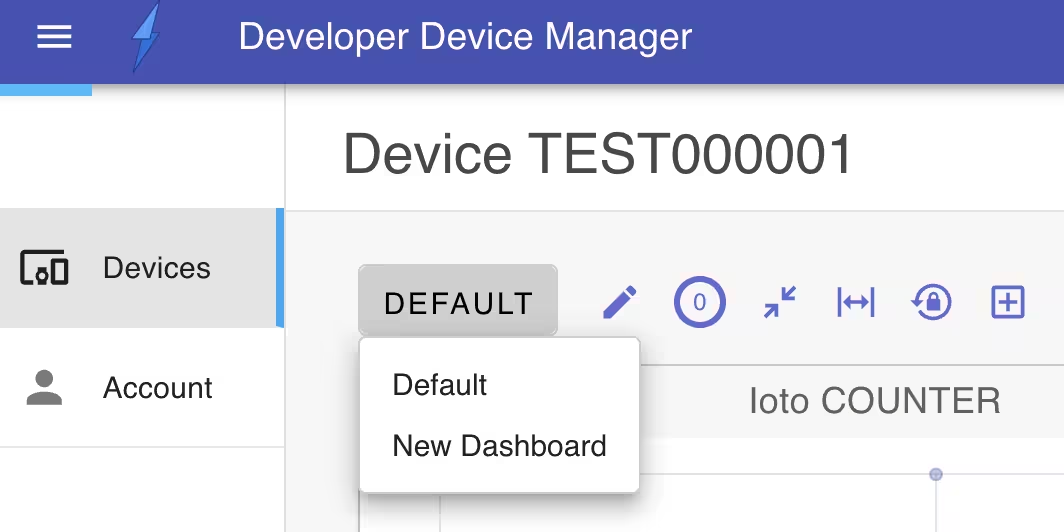
To create a new dashboard, select “New Dashboard” to display the dashboard slide out panel. Then enter your desired dashboard name and configuration.
Want More Now?
To learn more about EmbedThis Ioto, please read:
{{comment.name}} said ...
{{comment.message}}